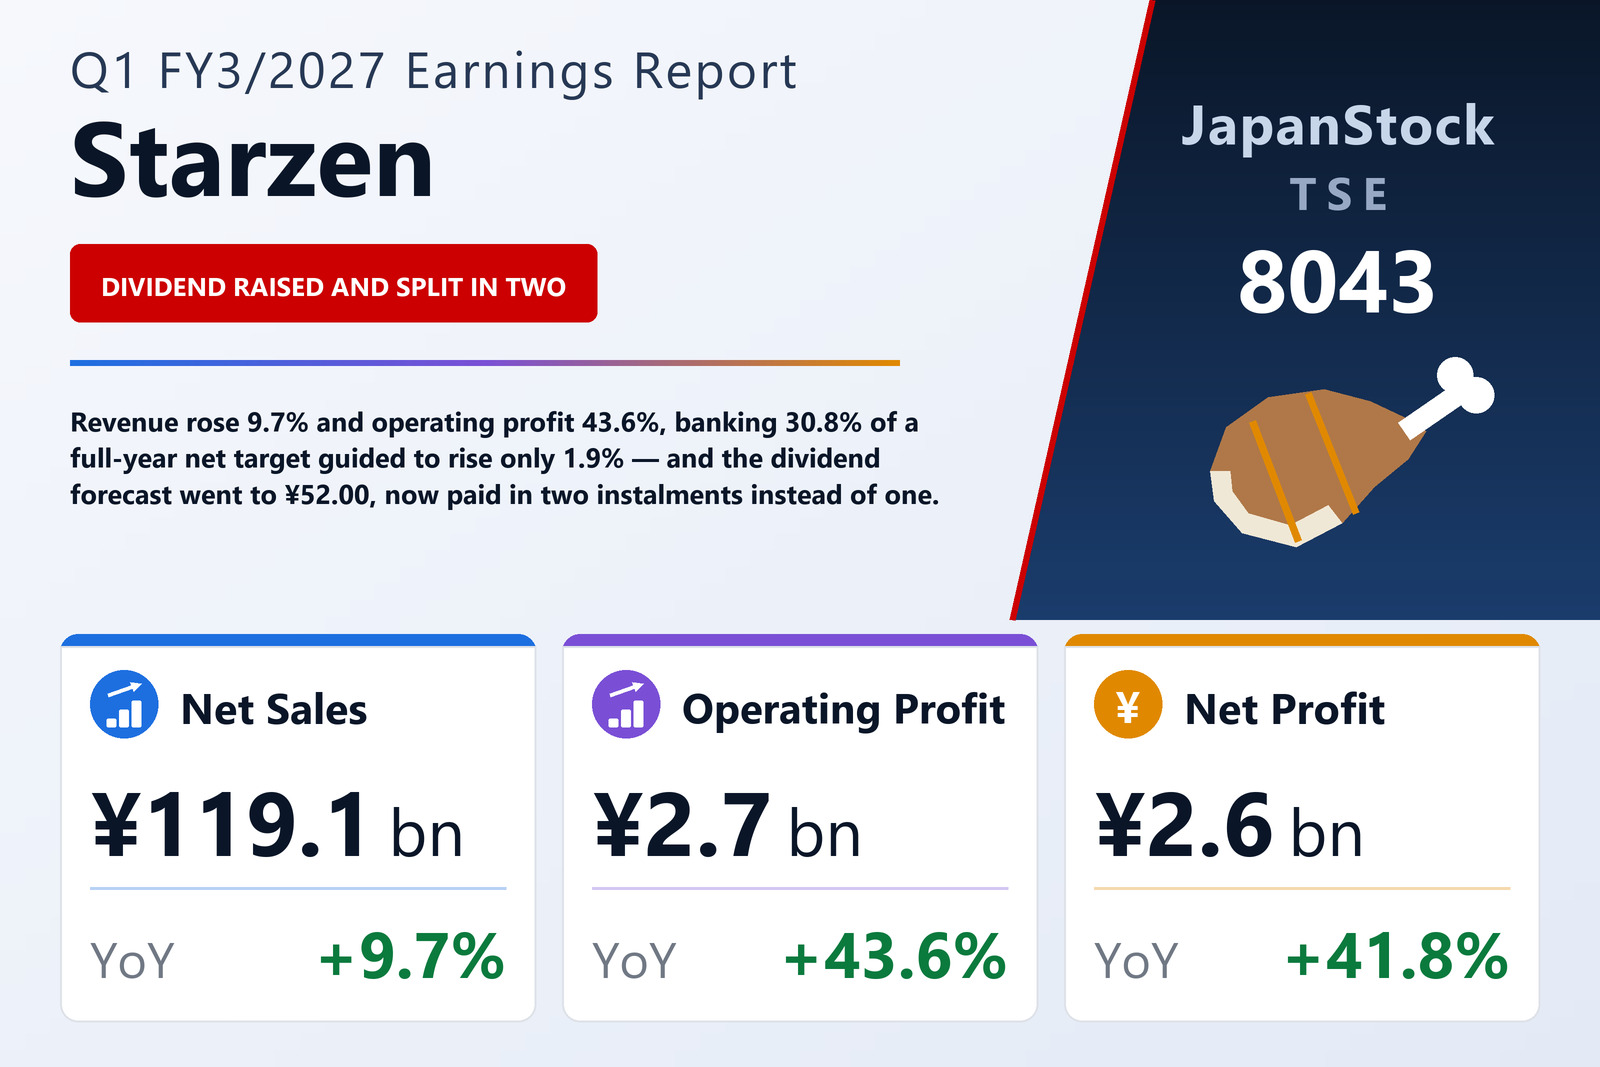
A 9.7% revenue increase carried a 43.6% jump in operating profit
Starzen Co., Ltd. (TSE: 8043), the Tokyo-based meat group whose business runs from livestock production through slaughter, processing and manufacturing to wholesale distribution, published consolidated results for the three months to June 30, 2026 on August 13, 2026 under Japanese GAAP. Revenue rose 9.7% to ¥119,143 million, operating profit 43.6% to ¥2,656 million, ordinary profit 48.0% to ¥3,790 million and net profit attributable to owners of the parent 41.8% to ¥2,616 million, for basic earnings per share of ¥45.80 against ¥32.28. Comprehensive income grew far less, up 19.6% to ¥2,420 million — a divergence explained further down.
The leverage starts at the gross line. Gross profit rose 15.0% to ¥11,868 million from ¥10,317 million, well ahead of the 9.7% revenue increase, lifting the gross margin from 9.50% to 9.96%. Selling, general and administrative expenses grew only 8.8% to ¥9,211 million, slower than revenue, so that ratio eased from 7.80% to 7.73%. Together the two moves took the operating margin from 1.70% to 2.23%. These remain thin margins — this is a wholesale business, and the company describes an environment of high feed, energy and packaging costs — but on a base that low, half a percentage point is a 43.6% profit increase.
Processed foods, not meat, supplied two thirds of the growth
The filing has a single reportable segment, the Meat-related Business, and omits a segment note on the ground that everything else is immaterial. It does, however, break revenue down by business division. Meat-related revenue rose 9.9% to ¥118,373 million while other businesses fell 7.6% to ¥770 million. Inside the meat business, Processed Foods rose 37.3% to ¥25,403 million — an increase of ¥6,901 million, which is 65.3% of the group's entire ¥10,563 million revenue gain — while Meat itself, three and a half times the size, grew 4.2% to ¥90,357 million, or ¥3,635 million. Ham and sausage was effectively flat at ¥2,090 million (+0.7%) and other meat-related products rose 17.1% to ¥522 million.
Some of that processed-foods jump was bought rather than grown. Three companies entered the consolidation this quarter and none left: Osabe Foods Co., Ltd. (株式会社オサベフーズ), a maker of frozen hamburg steak acquired outright for ¥4,300 million on April 1, 2026, together with Marutoyo Foods Co., Ltd. (マルトヨ食品株式会社) and Chorei Co., Ltd. (株式会社超冷). The filing does not say how much of the ¥6,901 million came from them. Within the meat business the two halves moved in opposite directions on profitability: domestic meat sold more at high market prices but its gross profit fell, while imported meat — where prices also stayed high on firm local markets and a weak yen — delivered forward-contracted volumes smoothly and grew both revenue and gross profit.
A third of ordinary profit is made below the operating line
Ordinary profit of ¥3,790 million sits ¥1,134 million above operating profit, a gap that widened from ¥711 million a year earlier and that is 29.9% of the ordinary figure. Non-operating income was ¥1,625 million against ¥1,018 million, and two lines dominate it: equity in earnings of affiliates of ¥708 million (from ¥518 million) and subsidy income of ¥434 million (from ¥60 million), a ¥374 million increase off the smallest of last year's items. Insurance proceeds and dividends fell to ¥146 million from ¥223 million; dividend income was ¥110 million, real-estate rental income ¥31 million and interest income ¥18 million. Non-operating expenses rose to ¥491 million from ¥307 million, almost entirely because interest expense rose to ¥376 million from ¥211 million as the group took on debt.
Below that the two extraordinary columns nearly cancel. Gains of ¥634 million were almost all a ¥630 million gain on the sale of investment securities; losses of ¥651 million were mostly a ¥591 million settlement payment, plus ¥60 million of other items. Pre-tax profit was ¥3,772 million, income taxes ¥1,155 million — an effective rate of 30.6% against 27.8% a year earlier — and quarterly profit ¥2,617 million, of which non-controlling interests took ¥0 million. That securities sale matters twice over: the ¥630 million gain reached the income statement by being taken out of accumulated other comprehensive income, which is where the next section begins.
Net assets fell ¥37 million despite ¥2,616 million of profit
Net assets closed at ¥95,696 million, ¥37 million below the ¥95,733 million of March 31, 2026, and the balance sheet shows both halves of why. Retained earnings rose only ¥160 million, to ¥67,368 million, because the FY3/2026 year-end dividend of ¥43.00 per share was paid during the quarter; on the 57,145,728 shares outstanding excluding treasury stock at March 31, 2026 that is roughly ¥2,457 million, which against ¥2,616 million of profit leaves about the ¥160 million actually retained. That multiplication is ours, from figures the filing states — it does not print the cash amount. The other half is accumulated other comprehensive income, down ¥197 million to ¥5,728 million. Other comprehensive income for the quarter was negative ¥196 million: −¥574 million on available-for-sale securities, −¥74 million on deferred hedges and −¥14 million on retirement benefits, against +¥312 million of foreign-currency translation and +¥154 million from equity-method affiliates. That is why comprehensive income grew 19.6% while net profit grew 41.8%.
Meanwhile the denominator moved a long way. Total assets rose ¥11,389 million to ¥213,524 million. Current assets added ¥5,238 million to ¥130,678 million, driven by merchandise and finished goods up ¥10,493 million to ¥54,629 million, against receivables down ¥3,704 million to ¥32,576 million and advance payments down ¥2,155 million to ¥14,786 million. Non-current assets added ¥6,103 million to ¥82,797 million, with goodwill more than doubling to ¥4,915 million — the Osabe acquisition booked ¥2,665 million of provisional goodwill, amortized evenly over ten years, of which ¥126 million was charged this quarter — and property, plant and equipment up ¥4,460 million to ¥46,698 million. It was funded with debt: liabilities rose ¥11,426 million to ¥117,827 million as bonds went from nil to ¥10,100 million and long-term borrowings from ¥29,135 million to ¥36,252 million, while a ¥5,000 million bond due within the year was redeemed and short-term borrowings fell to ¥8,342 million. With equity flat and assets up 5.6%, the equity ratio fell 2.6 points to 44.8%.
Guidance untouched; the dividend was not
Full-year FY3/2027 guidance is unchanged from the forecast published with the annual results on May 14, 2026: revenue of ¥470,000 million (+4.9%), operating profit of ¥9,200 million (+5.0%), ordinary profit of ¥11,400 million (+3.4%) and net profit of ¥8,500 million (+1.9%), for earnings per share of ¥148.75. This first quarter therefore delivered 30.8% of the full-year profit target (¥2,616 million of ¥8,500 million), 33.2% of the ordinary-profit target, 28.9% of the operating target and 25.3% of the revenue target — in a year guided to grow net profit by just 1.9%. The filing offers no comment on that gap. Its entire statement on guidance is that there is no change from the May forecast; it does not say whether the quarter ran ahead of plan, and it publishes no half-year split against which the run rate could be judged.
The dividend is the one forecast that did move, and the two flags on the cover page differ: earnings guidance is marked as not revised, dividend guidance as revised, with a dedicated increase notice published the same day. FY3/2026 paid ¥43.00 per share, all of it at the year-end, with no interim payment. FY3/2027 is now forecast at ¥52.00, a 20.9% increase, and the shape changes as well as the size: ¥26.00 at the interim and ¥26.00 at the year-end. So the company is both raising the payout and beginning to pay it twice a year. No first-quarter dividend is payable and the filing lists no payment start date. Against guided earnings per share of ¥148.75, ¥52.00 is a payout ratio of about 35%.
| Metric | Q1 FY3/2027 | Q1 FY3/2026 | Change |
|---|---|---|---|
| Net sales (¥ million) | 119,143 | 108,580 | +9.7% |
| Gross profit (¥ million) | 11,868 | 10,317 | +15.0% |
| Gross margin | 9.96% | 9.50% | +0.46 pt |
| SG&A expenses (¥ million) | 9,211 | 8,466 | +8.8% |
| Operating profit (¥ million) | 2,656 | 1,850 | +43.6% |
| Operating margin | 2.23% | 1.70% | +0.53 pt |
| Ordinary profit (¥ million) | 3,790 | 2,561 | +48.0% |
| Net profit attrib. to owners of parent (¥ million) | 2,616 | 1,845 | +41.8% |
| Comprehensive income (¥ million) | 2,420 | 2,024 | +19.6% |
| EPS (¥) | 45.80 | 32.28 | +41.9% |
| Meat-related Business — revenue (¥ million) | 118,373 | 107,746 | +9.9% |
| Meat — revenue (¥ million) | 90,357 | 86,722 | +4.2% |
| Processed Foods — revenue (¥ million) | 25,403 | 18,501 | +37.3% |
| Ham and Sausage — revenue (¥ million) | 2,090 | 2,076 | +0.7% |
| Other meat-related products — revenue (¥ million) | 522 | 446 | +17.1% |
| Other Businesses — revenue (¥ million) | 770 | 833 | −7.6% |
| Total assets (¥ million) | 213,524 | 202,134 | +5.6% |
| Net assets (¥ million) | 95,696 | 95,733 | −0.04% |
| Shareholders' equity (¥ million) | 95,692 | 95,729 | −0.04% |
| Equity ratio | 44.8% | 47.4% | −2.6 pt |
| FY3/2027 guidance — revenue (¥ million) | 470,000 | — | +4.9% |
| FY3/2027 guidance — operating profit (¥ million) | 9,200 | — | +5.0% |
| FY3/2027 guidance — ordinary profit (¥ million) | 11,400 | — | +3.4% |
| FY3/2027 guidance — net profit (¥ million) | 8,500 | — | +1.9% |
| FY3/2027 guidance — EPS (¥) | 148.75 | — | n.m. |
| Annual dividend per share (¥) | 52.00 | 43.00 | +20.9% |
JapanStockPulse provides informational content only and does not constitute investment advice. Figures are taken from the company's published earnings short report and may be subject to subsequent revision.