All of the profit growth came from the smaller half of the group
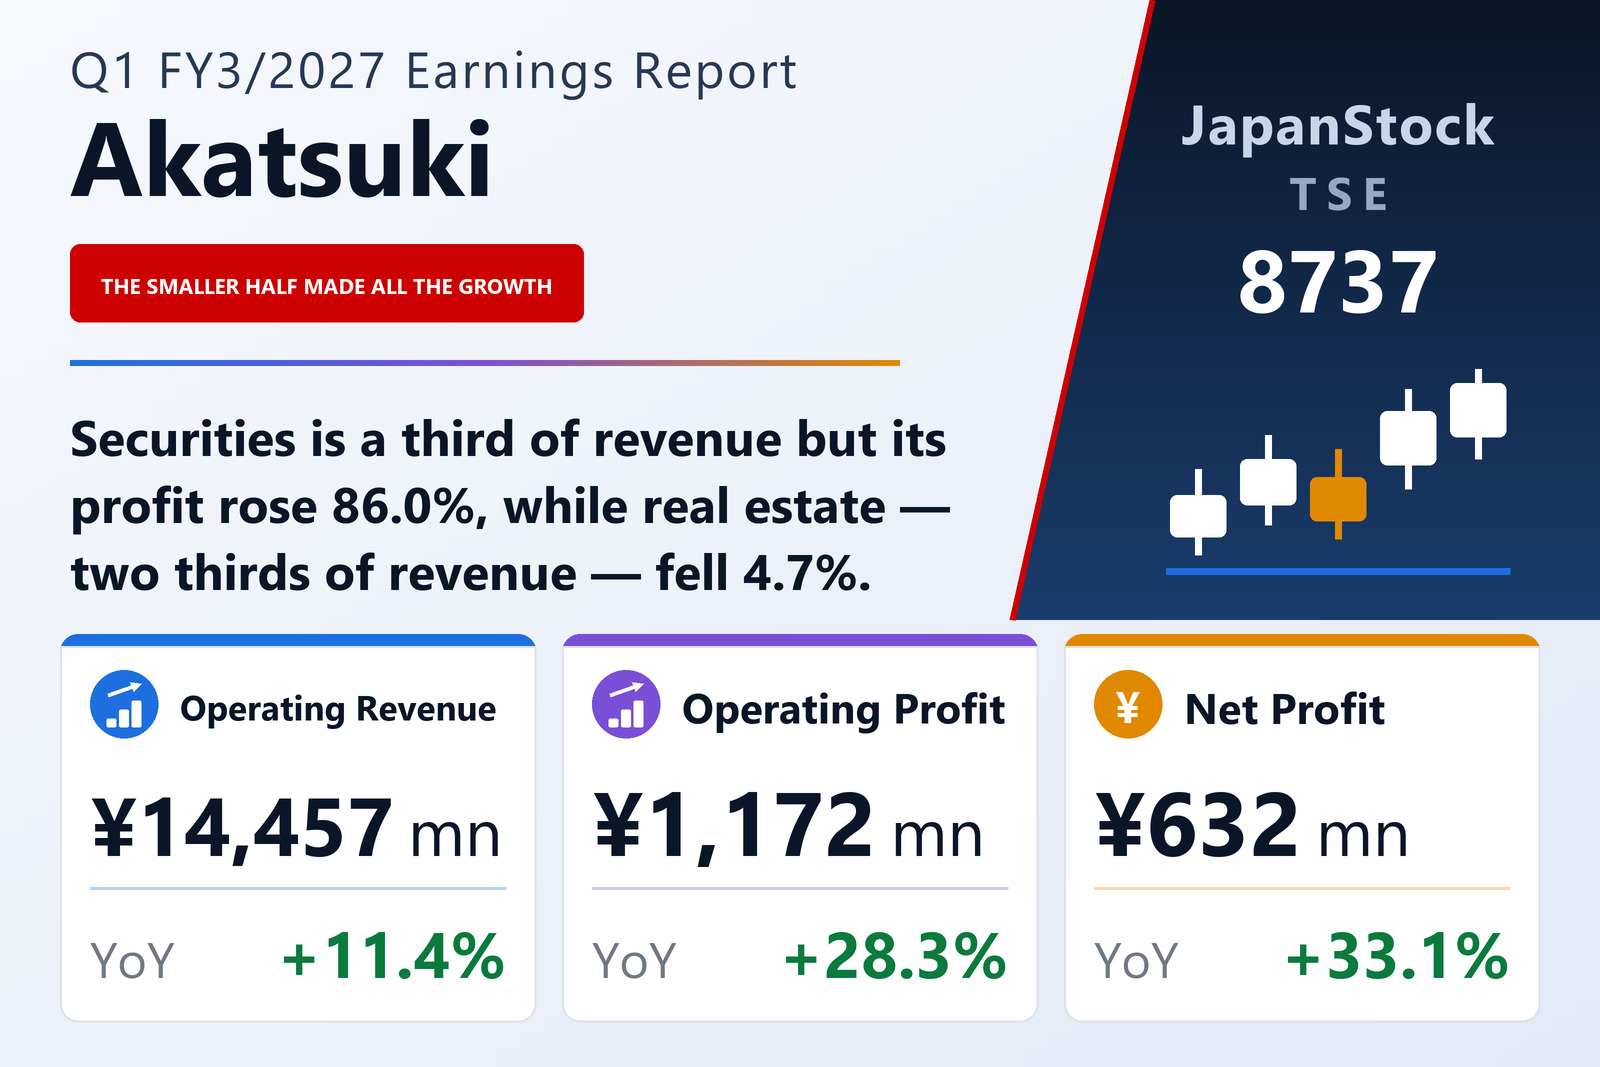
Akatsuki Corp. (TSE: 8737) — 株式会社あかつき本社, the Tokyo-listed holding company that owns Akatsuki Securities Co., Ltd. and a cluster of second-hand condominium, renovation and senior-care businesses — published consolidated results for the three months to June 30, 2026 on August 13, 2026 under Japanese GAAP. Operating revenue rose 11.4% to ¥14,457 million, operating profit 28.3% to ¥1,172 million, ordinary profit 26.8% to ¥1,063 million and profit attributable to owners of the parent 33.1% to ¥632 million, giving earnings of ¥20.90 per share against ¥15.71. Comprehensive income rose 37.5% to ¥664 million.
The two reported segments moved in opposite directions. Securities revenue rose 51.8% to ¥4,765 million and its segment profit 86.0% to ¥689 million. Real Estate, which is about two-thirds of group revenue, saw revenue fall 1.5% to ¥9,769 million and profit 4.7% to ¥773 million. Combined segment profit rose ¥281 million, of which Securities supplied ¥319 million while Real Estate gave back ¥38 million; head-office costs and inter-segment eliminations then took ¥291 million, against ¥268 million a year earlier. The growth is entirely in the third of the business that sells advice, not in the two thirds that sells flats.
Two revenue lines that say different things
A group of this shape reports two top lines and they behave differently. Operating revenue of ¥14,457 million is gross: it counts the full sale price of every condominium the real-estate arm resells. Net operating revenue of ¥6,413 million is what is left after the ¥8,029 million cost of those properties and ¥14 million of financial expenses, and it rose 33.6% where the gross line rose 11.4%. That 22-point gap is the quarter in one number: the half of the group that books revenue gross barely moved, while the half that books commissions grew by half.
Inside the securities revenue, commissions received rose from ¥1,588 million to ¥2,844 million — an increase of ¥1,256 million the company attributes to higher equity brokerage commissions and trust fees — and trading gains rose from ¥1,352 million to ¥1,668 million. Costs followed the revenue up. Selling, general and administrative expenses rose from ¥3,885 million to ¥5,241 million, with transaction-related expenses up from ¥1,438 million to ¥2,333 million and personnel costs from ¥1,293 million to ¥1,695 million. Net operating revenue gained ¥1,614 million on the year and SG&A ¥1,355 million — about 84% of the increase was consumed by cost, which is why operating profit grew 28.3% against net operating revenue's 33.6%.
The securities business is built through intermediaries, not branches
Akatsuki Securities' stated strategy is to expand the financial-instruments intermediary (IFA) business and strengthen alliances with financial institutions, and the filing measures it directly. At June 30, 2026 there were 1,977 registered sales representatives at contracted intermediaries, 23 more than at March 31. Client assets under custody, including balances managed at the partner financial institutions of subsidiary Japan Wealth Advisors Inc., reached ¥904.6 billion, up ¥100.8 billion in three months, and the IFA division's own custody balance ¥602.0 billion, up ¥79.5 billion. The supporting detail is deliberately unglamorous: more telephone operators to cut waiting times for intermediaries, wider real-time market-information content for them, a new page of individual foreign-bond listings on the website, and a domestic investment-trust line-up extended to 1,043 funds, with space-related and AI-related funds named as what investors were asking for. After the quarter closed, in July 2026, the firm began offering 「ファンドラップAXIS」 (Fund Wrap AXIS), a wrap account sold in two versions — an AI-managed course and a select course.
Real estate sold 49 fewer flats, at higher prices
MyPlace Inc., which buys second-hand condominiums, renovates them and resells them, bought 180 units in the quarter against 230 a year earlier and sold 153 against 202. The filing gives the reason without hedging: sales in the previous financial year ran ahead of plan, so the company started this year with less inventory. Unit selling prices rose against a strong market, concentrated in central-Tokyo properties, which is why segment revenue came in roughly level despite 49 fewer sales and segment profit fell only 4.7%. Bautec Group Inc., which designs and carries out the renovations, completed 268 units against 252, of which 83 were for outside resellers. EW Asset Management Inc. had three senior-care facilities in operation at June 30, with occupancy still rising at メディケア癒やしDX長嶺 in Kumamoto (opened September 2024) and メディケア癒やし五番館長住 in Fukuoka (opened April 2025).
The inventory is being rebuilt rather than run down: unsold second-hand flats stood at 750 units at June 30 against 723 at March 31, 378 of them vacant and 372 tenanted. A new Fukuoka sales office opened in July, adding a third territory to the existing Greater Tokyo area (Tokyo, Kanagawa, Chiba, Saitama) and Kansai (Osaka, Hyogo, Kyoto). Both are decisions that cost money now and can only show up in revenue later.
A balance sheet that grew ¥8.0 billion while equity did not
Total assets rose ¥8,037 million to ¥111,902 million, but net assets rose only ¥62 million, to ¥21,759 million, so the equity ratio fell from 20.2% to 18.8%. The filing itemises both sides. Cash and deposits rose ¥3,116 million, guarantee money deposited ¥4,037 million and real estate held for sale ¥4,052 million, while deposits with clearing organisations fell ¥4,775 million; on the other side customer deposits received rose ¥9,709 million, against ¥1,074 million less short-term debt and ¥1,091 million less income tax payable. Neither growing item is equity-funded — client money held for broking customers grows with the custody balance and sits there as a liability, and property inventory is bought with borrowings. Retained earnings rose just ¥43 million against ¥632 million of attributable profit, the difference being largely the ¥17.50 FY3/2026 year-end dividend paid during the quarter. That borrowing also explains why ordinary profit of ¥1,063 million sits below operating profit of ¥1,172 million: non-operating expenses were ¥231 million, of which ¥200 million was interest paid, against ¥154 million a year earlier.
A quarter that beat the prior year, inside a year guided down
Full-year guidance is unchanged from the forecast published on May 27, 2026 alongside a new five-year set of management numerical targets: operating revenue of ¥70,000 million (+1.9%), operating profit of ¥5,600 million (−10.8%), ordinary profit of ¥5,100 million (−18.7%) and profit attributable to owners of ¥3,300 million (−18.6%), for earnings of ¥109.03 per share. The company additionally discloses, as reference information, a pre-tax profit forecast of ¥5,100 million (−18.4%). The tension is not reconciled anywhere in the document: the first quarter beat the prior year by between 26.8% and 37.5% on every profit line, and its ¥1,172 million of operating profit is already 20.9% of the ¥5,600 million guided for the year, yet the year is guided to shrink by a tenth at the operating line and by nearly a fifth below it. The filing says only that there is no change. The dividend forecast is likewise unchanged in total at ¥30.00 for the year, though the split moves from ¥12.50 interim and ¥17.50 final in FY3/2026 to ¥15.00 and ¥15.00 — a division the company notes is the position "at the present time".
| Metric | Q1 FY3/2027 | Q1 FY3/2026 | Change |
|---|---|---|---|
| Operating revenue (¥ million) | 14,457 | 12,979 | +11.4% |
| Net revenue (¥ million) | 6,413 | 4,799 | +33.6% |
| SG&A expenses (¥ million) | 5,241 | 3,885 | +34.9% |
| Operating profit (¥ million) | 1,172 | 914 | +28.3% |
| Ordinary profit (¥ million) | 1,063 | 839 | +26.8% |
| Pre-tax profit (¥ million) | 1,065 | 839 | +26.9% |
| Net profit attrib. to owners of parent (¥ million) | 632 | 475 | +33.1% |
| Comprehensive income (¥ million) | 664 | 483 | +37.5% |
| EPS (¥) | 20.90 | 15.71 | +33.0% |
| Securities — revenue (¥ million) | 4,765 | 3,138 | +51.8% |
| Securities — segment profit (¥ million) | 689 | 370 | +86.0% |
| Real Estate — revenue (¥ million) | 9,769 | 9,913 | −1.5% |
| Real Estate — segment profit (¥ million) | 773 | 811 | −4.7% |
| Total assets (¥ million) | 111,902 | 103,864 | +7.7% |
| Net assets (¥ million) | 21,759 | 21,697 | +0.3% |
| Equity attrib. to owners of parent (¥ million) | 21,061 | 21,008 | +0.3% |
| Equity ratio | 18.8% | 20.2% | −1.4 pt |
| FY3/2027 guidance — operating revenue (¥ million) | 70,000 | — | +1.9% |
| FY3/2027 guidance — operating profit (¥ million) | 5,600 | — | −10.8% |
| FY3/2027 guidance — ordinary profit (¥ million) | 5,100 | — | −18.7% |
| FY3/2027 guidance — pre-tax profit (¥ million) | 5,100 | — | −18.4% |
| FY3/2027 guidance — net profit (¥ million) | 3,300 | — | −18.6% |
| FY3/2027 guidance — EPS (¥) | 109.03 | — | n.m. |
| Annual dividend per share (¥) | 30.00 | 30.00 | unchanged |
JapanStockPulse provides informational content only and does not constitute investment advice. Figures are taken from the company's published earnings short report and may be subject to subsequent revision.