Less cargo, more revenue
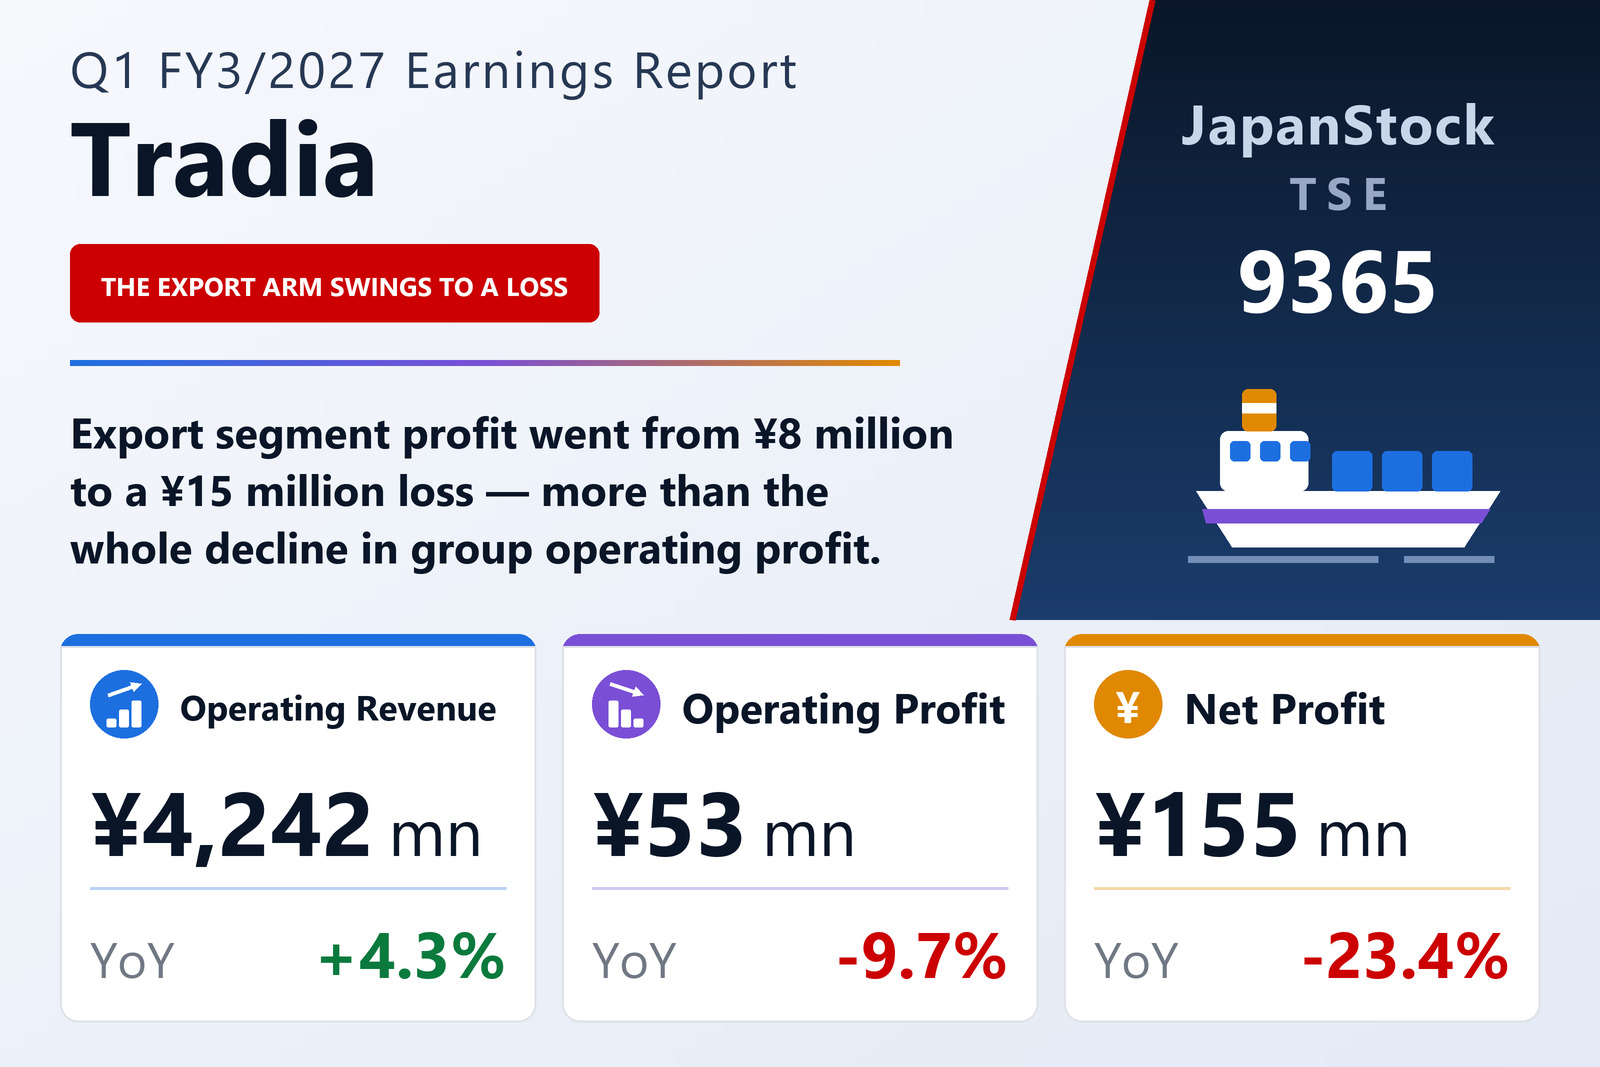
TRADIA CORPORATION (TSE: 9365), the Kobe-based freight forwarder and customs broker, published consolidated results for the three months to June 30, 2026 on August 13, 2026 under Japanese GAAP. Total handling volume fell 11.4% year on year and operating revenue still rose 4.3% to ¥4,242 million, an increase of a little over ¥174 million. Operating profit fell 9.7% to ¥53 million, ordinary profit 21.1% to ¥214 million and net profit attributable to owners of the parent 23.4% to ¥155 million, for earnings per share of ¥106.32 against ¥138.73. Comprehensive income went the other way, up 25.6% to ¥354 million.
The gap between volume and revenue is where the quarter starts. The company says a weak yen supported export cargo, whose handling volume ran above the prior year, while import volumes were held back by the inflation that same weak yen produced at home; in ocean-container transport the volume handled fell but freight rates rose after tension around the Strait of Hormuz drove up crude and prompted surcharges. Revenue therefore grew on less cargo. Costs did not co-operate: gross operating profit fell 1.4% to ¥267 million (¥267,098 thousand against ¥270,790 thousand) on pay rises and higher depreciation — the depreciation charge rose to ¥66,270 thousand from ¥43,629 thousand, up 51.9% — and general administrative expenses rose 0.9% to ¥213 million. Operating profit was left about ¥5 million lower, at ¥53 million.
Export swung to a loss while every other segment held or improved
Export did the damage. Its handling volume rose 2.5% and its revenue 3.1% to ¥691 million, but the company says it could not absorb pay rises and other cost increases, and the segment posted a loss of ¥15 million against an ¥8 million profit a year earlier. That swing of roughly ¥23 million — from ¥8,316 thousand of profit to ¥15,457 thousand of loss — is about four times the ¥5 million by which group operating profit fell, which is only possible because everything else held or improved. Import lost 18.4% of its handling volume and still grew revenue 1.6% to ¥1,333 million and profit 369.5% to ¥18 million, because handling work and storage-fee income at the group's own warehouses rose sharply. Warehousing was flat at ¥13 million of revenue and ¥12 million of profit. Other — stevedoring and sundry businesses — fell 2.1% to ¥38 million of revenue, a figure that includes ¥6 million of inter-segment revenue eliminated on consolidation, and 15.6% to ¥6 million of profit.
International, at ¥2,172 million, is 51.2% of operating revenue and the one segment that grew both lines meaningfully: revenue 6.6% and profit 18.8% to ¥31 million. Both halves show the same pattern of less cargo at better prices. On the export side, handling volume fell 25.3% — a payback against a strong prior year for semiconductor-related equipment and paper — while revenue rose 7.7% on machinery, steel and foodstuffs bound for India and Southeast Asia. On the import side, volume fell 2.1% as Chinese home appliances and sundries slowed, while revenue rose 6.3% on Chinese-medicine raw materials, hygiene goods and clothing from China and Southeast Asia, helped by urgent air-freight work. The company attributes the segment's revenue growth to the freight-rate surcharges introduced after the Middle East tension and to the continued weakness of the yen.
The profit is made below the operating line
Ordinary profit of ¥214 million is four times operating profit of ¥53 million, and it was 4.6 times a year ago. What sits between them is a portfolio. Non-operating income of ¥189 million (¥189,910 thousand, down 18.3% from ¥232,457 thousand) is mostly interest and dividend income of ¥150 million, down 14.7% from ¥176 million, plus equity-method investment income of ¥16 million, down 42.6% from ¥29 million; the filing names exactly those two lines as the reason ordinary profit fell 21.1%. Against them, interest expense rose 47.3% to ¥28 million from ¥19 million. There were no extraordinary items this quarter against ¥2 million of asset-disposal and lease-cancellation losses a year ago, so pre-tax profit equals ordinary profit at ¥214 million, and tax of ¥58 million left net profit at ¥155 million. One structural change: TRALINKS CO., LTD. entered the scope of equity-method accounting this quarter because it became financially material — which makes the fall in equity-method income the more notable.
Comprehensive income of ¥354 million is 2.3 times net profit of ¥155 million, because other comprehensive income was ¥198 million (¥198,558 thousand against ¥78,694 thousand). Three items make it up: a ¥175 million valuation gain on other securities, against ¥83 million a year earlier; a ¥3 million negative remeasurement of retirement benefit obligations, against a ¥4 million positive one; and ¥26 million as the group's share of equity-method affiliates' other comprehensive income, against an ¥8 million charge. The balance sheet identifies that third item: the foreign-currency translation reserve rose from ¥44,743 thousand to ¥71,070 thousand, an increase of ¥26,327 thousand — the same figure — so the group's currency exposure reaches comprehensive income through affiliates rather than through consolidated subsidiaries. The securities themselves are the larger point: investment securities rose 8.2% to ¥3,535 million, 25.5% of the ¥13,846 million balance sheet, and the valuation reserve inside net assets rose to ¥1,818 million from ¥1,642 million. None of that passed through the income statement.
Guidance unchanged, and the quarter ran the other way
Total assets rose ¥522 million to ¥13,846 million: current assets ¥3,847 million, up ¥111 million as advances paid and trade receivables rose while cash and other items fell, and non-current assets ¥9,998 million, up ¥410 million mainly on investment securities. Current liabilities rose ¥116 million to ¥4,063 million on the bonus provision; non-current liabilities fell ¥19 million to ¥3,441 million as long-term borrowings came down. Net assets rose ¥424 million to ¥6,340 million on retained earnings and the securities valuation reserve, and the equity ratio improved to 45.8% from 44.4%. Full-year guidance is unchanged from the May 13, 2026 forecast: operating revenue of ¥16,500 million (+0.3%), operating profit of ¥350 million (+48.6%), ordinary profit of ¥500 million (+2.3%) and net profit of ¥350 million (−3.3%), for earnings per share of ¥238.72. The shape of that guide is the opposite of the quarter just reported — near-flat revenue with operating profit up by half, against revenue up 4.3% with operating profit down 9.7% — and the running totals are lopsided the same way: first-quarter operating profit is 15.1% of its full-year guide while ordinary profit is already 42.8% of its own and net profit 44.3% of its own. The dividend forecast is unchanged at ¥50.00, payable entirely at the year-end. The quarterly statements were not reviewed by an accounting auditor, and no quarterly cash flow statement was prepared.
| Metric | Q1 FY3/2027 | Q1 FY3/2026 | Change |
|---|---|---|---|
| Operating revenue (¥ million) | 4,242 | 4,067 | +4.3% |
| Gross operating profit (¥ million) | 267 | 270 | −1.4% |
| General administrative expenses (¥ million) | 213 | 211 | +0.9% |
| Operating profit (¥ million) | 53 | 58 | −9.7% |
| Non-operating income (¥ million) | 189 | 232 | −18.3% |
| Interest and dividend income (¥ million) | 150 | 176 | −14.7% |
| Equity-method investment income (¥ million) | 16 | 29 | −42.6% |
| Interest expense (¥ million) | 28 | 19 | +47.3% |
| Ordinary profit (¥ million) | 214 | 272 | −21.1% |
| Net profit attrib. to owners of parent (¥ million) | 155 | 203 | −23.4% |
| Comprehensive income (¥ million) | 354 | 282 | +25.6% |
| Other comprehensive income — valuation difference on securities (¥ million) | 175 | 83 | +110.3% |
| EPS (¥) | 106.32 | 138.73 | −23.4% |
| Export — revenue (¥ million) | 691 | 670 | +3.1% |
| Export — segment profit (¥ million) | −15 | 8 | profit to loss |
| Import — revenue (¥ million) | 1,333 | 1,312 | +1.6% |
| Import — segment profit (¥ million) | 18 | 3 | +369.5% |
| International — revenue (¥ million) | 2,172 | 2,038 | +6.6% |
| International — segment profit (¥ million) | 31 | 26 | +18.8% |
| Warehousing — revenue (¥ million) | 13 | 13 | unchanged |
| Warehousing — segment profit (¥ million) | 12 | 12 | unchanged |
| Other — revenue (¥ million) | 38 | 39 | −2.1% |
| Other — segment profit (¥ million) | 6 | 7 | −15.6% |
| Total assets (¥ million) | 13,846 | 13,323 | +3.9% |
| Net assets (¥ million) | 6,340 | 5,915 | +7.2% |
| Equity ratio | 45.8% | 44.4% | +1.4 pt |
| Investment securities (¥ million) | 3,535 | 3,268 | +8.2% |
| FY3/2027 guidance — operating revenue (¥ million) | 16,500 | — | +0.3% |
| FY3/2027 guidance — operating profit (¥ million) | 350 | — | +48.6% |
| FY3/2027 guidance — ordinary profit (¥ million) | 500 | — | +2.3% |
| FY3/2027 guidance — net profit (¥ million) | 350 | — | −3.3% |
| FY3/2027 guidance — EPS (¥) | 238.72 | — | — |
| Annual dividend per share (¥) | 50.00 | 50.00 | unchanged |
JapanStockPulse provides informational content only and does not constitute investment advice. Figures are taken from the company's published earnings short report and may be subject to subsequent revision.