Revenue rose in all three segments; profit fell in all three
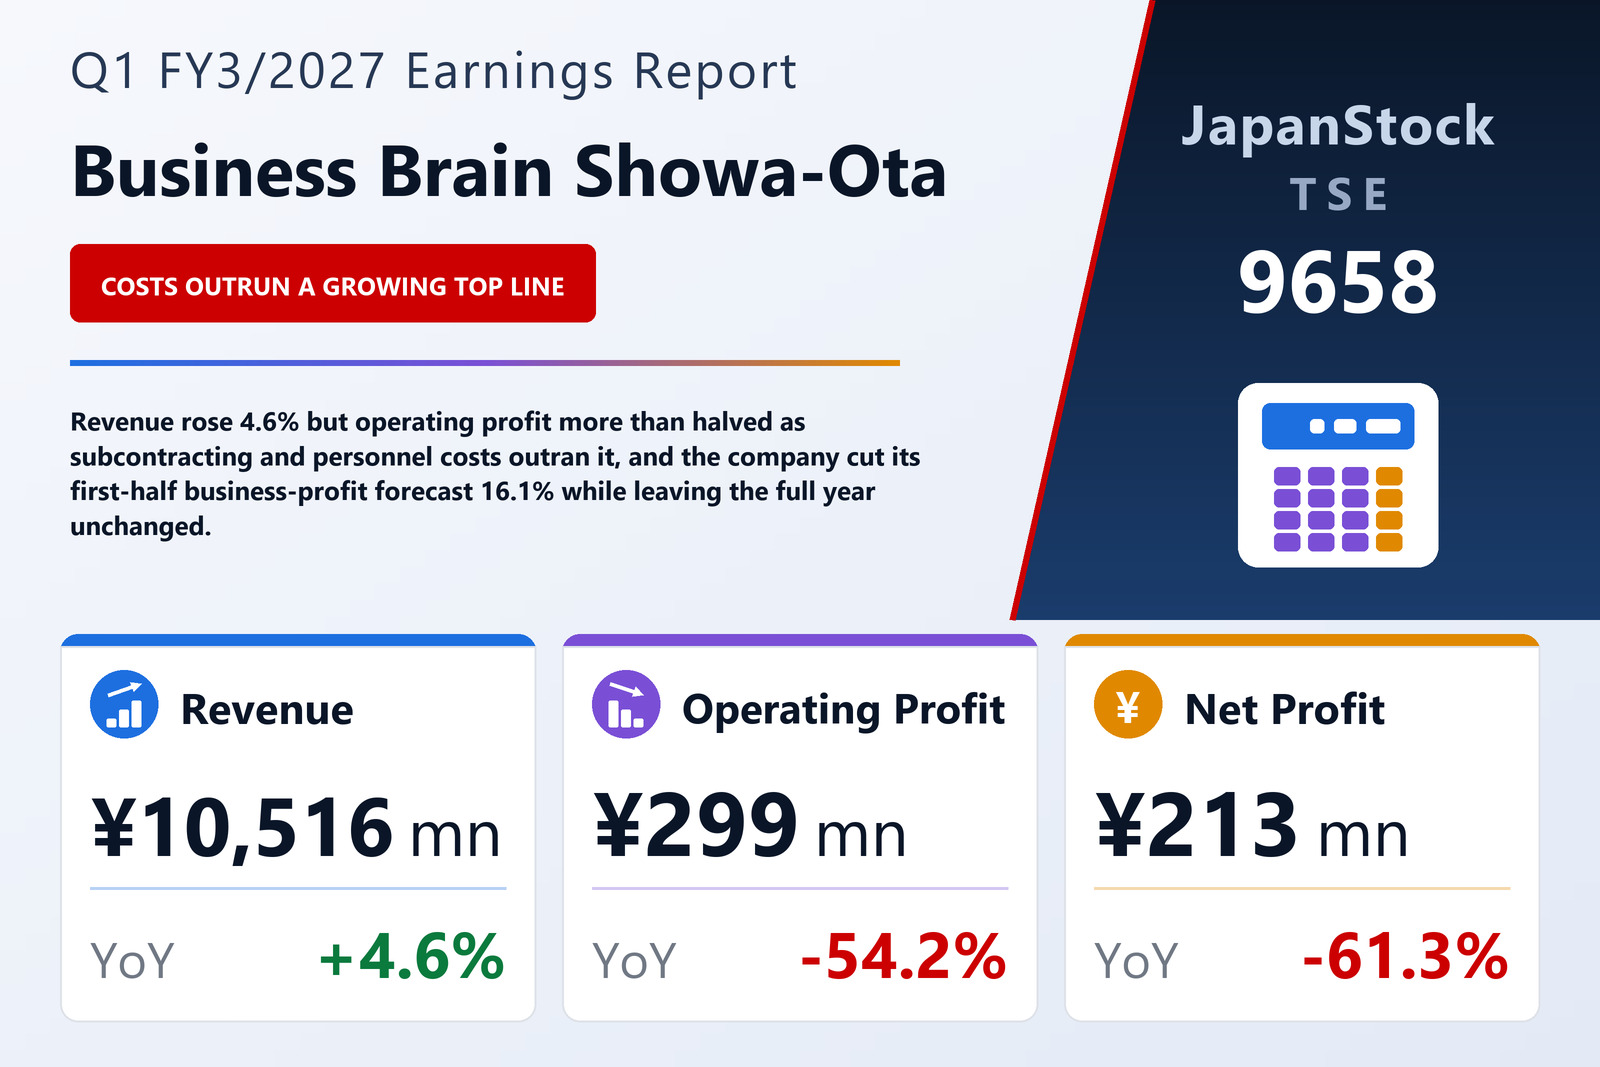
Business Brain Showa-Ota Inc. (TSE: 9658), the Tokyo-based systems house that builds and runs accounting, management-accounting and product-lifecycle systems for Japanese corporates, published consolidated results for the three months to June 30, 2026 on August 13, 2026 under IFRS. Revenue rose 4.6% to ¥10,516 million, but business profit and operating profit both fell 54.2% to ¥299 million, pre-tax profit 49.8% to ¥488 million, quarterly profit 60.7% to ¥220 million and profit attributable to owners of the parent 61.3% to ¥213 million, for basic earnings per share of ¥6.56 against ¥16.93. Total comprehensive income was ¥268 million, down 52.0%. Business profit — which this filing defines as operating profit excluding gains and losses arising from non-recurring factors — was identical to operating profit in both quarters, because the reconciliation the company publishes shows no non-recurring item in either.
The fall came even though revenue grew in every reported segment, and the income statement shows why in two lines. Cost of sales rose from ¥7,859 million to ¥8,344 million, or 6.2%, against 4.6% more revenue — the company attributes the increase to subcontracting costs and personnel costs together — so gross profit fell 0.9% to ¥2,172 million on a larger top line. Below it, selling, general and administrative expenses rose 23.1% to ¥1,898 million, which the company attributes to the use of AI and to active research and development on ACT-Horizon, its next-generation solution. Those two movements took the operating margin from 6.5% to 2.8%. Demand itself did not weaken: order intake was ¥10,508 million, up 5.8%, and the order backlog ¥13,537 million, up 5.1%.
Three segments up on revenue, down on profit — and a corporate line that doubled
Consulting & System Development, the largest of the three, grew revenue 3.9% to ¥5,654 million — the company credits management-accounting consulting and solutions, mainly at the parent — but business profit fell 23.6% to ¥351 million, with every business inside the segment down year on year on higher subcontracting costs. The SES Co-Creation Business (SES共創ビジネス), which supplies quasi-mandate system development and engineer dispatch, was almost flat on revenue at ¥2,293 million, up 0.4%, while business profit fell 17.6% to ¥97 million as labour and subcontracting costs cut its gross profit. BPO & Managed Services grew fastest and fell hardest: revenue up 9.6% to ¥2,670 million, business profit down 43.5% to ¥111 million, on higher personnel costs in payroll and accounting BPO, a delayed start to some projects, and the cost of relocating the Hamamatsu BPO Center.
The three segments together earned ¥559 million of business profit against ¥773 million a year earlier, a fall of ¥215 million. The other ¥139 million of the ¥354 million decline in operating profit is in the reconciliation item, and it is almost entirely one line: costs not attributable to any segment rose from ¥121 million to ¥263 million, more than doubling. Put the other way round, about two fifths of the profit decline sits outside the operating segments altogether — which is consistent with the company's own account of central spending on AI and on ACT-Horizon development, work that would not be charged to a delivery segment.
Below the operating line, equity-method income does the work
Pre-tax profit of ¥488 million is ¥189 million above the ¥299 million of operating profit, and the filing's own reconciliation names every item that closes the gap. The largest by far is the share of profit of investments accounted for using the equity method, which rose from ¥89 million to ¥142 million. Finance income fell sharply, from ¥269 million to ¥63 million, and finance costs fell with it, from ¥31 million to ¥14 million, while a loss on changes in equity interest narrowed from ¥9 million to ¥3 million. On balance the below-the-line items added ¥189 million this quarter against ¥319 million a year ago, which is why pre-tax profit fell 49.8% where operating profit fell 54.2%. Income tax expense of ¥268 million, against ¥413 million, left quarterly profit of ¥220 million, ¥213 million of it attributable to owners of the parent and ¥7 million to non-controlling interests.
The half-year forecast is cut 16%; the full year is left alone
The board resolved on August 13 to revise the first-half forecast published on May 14, 2026. Revenue is unchanged at ¥20,900 million, but business profit and operating profit are each cut by ¥250 million, from ¥1,550 million to ¥1,300 million — 16.1%; pre-tax profit falls from ¥2,010 million to ¥1,760 million, or 12.4%; interim profit from ¥1,304 million to ¥1,207 million and profit attributable to owners from ¥1,293 million to ¥1,197 million, both 7.4%; and interim earnings per share from ¥39.85 to ¥36.88. The company gives three reasons why every profit line below revenue undershot its own plan in the first quarter: lower utilisation caused by an uneven deployment of staff, delays in starting new projects, and costs arising from an office relocation. It says orders have remained firm and that some of these factors are one-off, so it expects profitability to improve stepwise from the second quarter onwards.
The full-year forecast was not revised. The cover page flags a guidance revision, but the company states plainly that it is leaving the full-year numbers as published because it first needs to see order trends, project progress and the pace of the profitability recovery. They remain revenue of ¥43,600 million (+3.6%), business profit and operating profit of ¥3,430 million — up 0.9% and 5.2% respectively, the difference between the two percentages being the prior year's non-recurring items — pre-tax profit of ¥4,290 million (+3.2%), profit attributable to owners of ¥2,848 million (−4.6%) and earnings per share of ¥87.76. Set against the reduced half-year figure, that arithmetic now requires ¥2,130 million of business profit in the second half against ¥1,300 million in the first, or 62% of the year in its back half, after a first quarter that produced ¥299 million. The revised half still implies a second quarter of roughly ¥1,001 million against ¥843 million a year earlier, since the prior first half earned ¥1,496 million of business profit with ¥653 million of it in the first quarter.
A flat balance sheet, and a dividend that reads as a cut but is not
Total assets were ¥48,418 million, ¥46 million lower than at March 31, 2026. Current assets fell ¥285 million to ¥20,239 million as ¥1,381 million of trade receivables were collected, partly offset by ¥866 million more contract assets and ¥356 million more other financial assets; non-current assets rose ¥239 million to ¥28,180 million on ¥182 million more property, plant and equipment and ¥107 million more equity-method investments. Those equity-method investments stand at ¥17,610 million, 36.4% of total assets — the single largest thing on the group's balance sheet, and the source of the profit line described above. Liabilities rose ¥427 million to ¥17,671 million, non-current liabilities accounting for ¥472 million of that on ¥396 million more lease liabilities. Equity fell ¥473 million to ¥30,747 million, and retained earnings fell ¥546 million to ¥26,158 million even though the quarter added ¥213 million of profit; the ratio of equity attributable to owners of the parent slipped to 62.5% from 63.4%. No cash flow statement is prepared for the first quarter; depreciation and amortisation was ¥432 million against ¥347 million.
A three-for-one stock split took effect on April 1, 2026, and it makes the dividend table read as a collapse when it is nothing of the kind. FY3/2026's actual dividend of ¥135.00 — ¥66.50 at the interim and ¥68.50 at the year-end — is stated before the split, while the FY3/2027 forecast of ¥47.00, ¥23.50 at each of the interim and the year-end, is stated after it. On the same basis the forecast is ¥141.00 against ¥135.00, a rise of 4.4%, and the company records no revision to its dividend forecast. Per-share earnings, by contrast, are already restated: the ¥16.93 shown for the prior first quarter assumes the split had happened at the start of that year, so the fall to ¥6.56 is real. One comparison point is softer than it looks — the prior first quarter's figures were themselves restated when the provisional accounting for a business combination was finalised in the second quarter of FY3/2026, so the base this quarter is measured against is not the one originally published.
| Metric | Q1 FY3/2027 | Q1 FY3/2026 | Change |
|---|---|---|---|
| Revenue (¥ million) | 10,516 | 10,052 | +4.6% |
| Gross profit (¥ million) | 2,172 | 2,192 | −0.9% |
| SG&A expenses (¥ million) | 1,898 | 1,542 | +23.1% |
| Business profit (¥ million) | 299 | 653 | −54.2% |
| Operating profit (¥ million) | 299 | 653 | −54.2% |
| Operating margin | 2.8% | 6.5% | −3.7 pt |
| Pre-tax profit (¥ million) | 488 | 972 | −49.8% |
| Net profit (¥ million) | 220 | 559 | −60.7% |
| Net profit attrib. to owners of parent (¥ million) | 213 | 550 | −61.3% |
| Comprehensive income (¥ million) | 268 | 560 | −52.0% |
| EPS (¥) | 6.56 | 16.93 | −61.3% |
| Orders received (¥ million) | 10,508 | — | +5.8% |
| Order backlog (¥ million) | 13,537 | — | +5.1% |
| Consulting & System Development — revenue (¥ million) | 5,654 | 5,441 | +3.9% |
| Consulting & System Development — business profit (¥ million) | 351 | 459 | −23.6% |
| SES Co-Creation Business — revenue (¥ million) | 2,293 | 2,283 | +0.4% |
| SES Co-Creation Business — business profit (¥ million) | 97 | 117 | −17.6% |
| BPO & Managed Services — revenue (¥ million) | 2,670 | 2,436 | +9.6% |
| BPO & Managed Services — business profit (¥ million) | 111 | 197 | −43.5% |
| Total assets (¥ million) | 48,418 | 48,464 | −0.1% |
| Shareholders' equity (¥ million) | 30,747 | 31,220 | −1.5% |
| Equity attrib. to owners of parent (¥ million) | 30,250 | 30,716 | −1.5% |
| Equity ratio | 62.5% | 63.4% | −0.9 pt |
| FY3/2027 guidance — revenue (¥ million) | 43,600 | — | +3.6% |
| FY3/2027 guidance — business profit (¥ million) | 3,430 | — | +0.9% |
| FY3/2027 guidance — operating profit (¥ million) | 3,430 | — | +5.2% |
| FY3/2027 guidance — pre-tax profit (¥ million) | 4,290 | — | +3.2% |
| FY3/2027 guidance — net profit (¥ million) | 2,848 | — | −4.6% |
| FY3/2027 guidance — EPS (¥) | 87.76 | — | n.m. |
| Annual dividend per share (¥) | 47.00 | 135.00 | n.m. |
| Annual dividend per share, restated for the 3-for-1 split (¥) | 47.00 | 45.00 | +4.4% |
JapanStockPulse provides informational content only and does not constitute investment advice. Figures are taken from the company's published earnings short report and may be subject to subsequent revision.