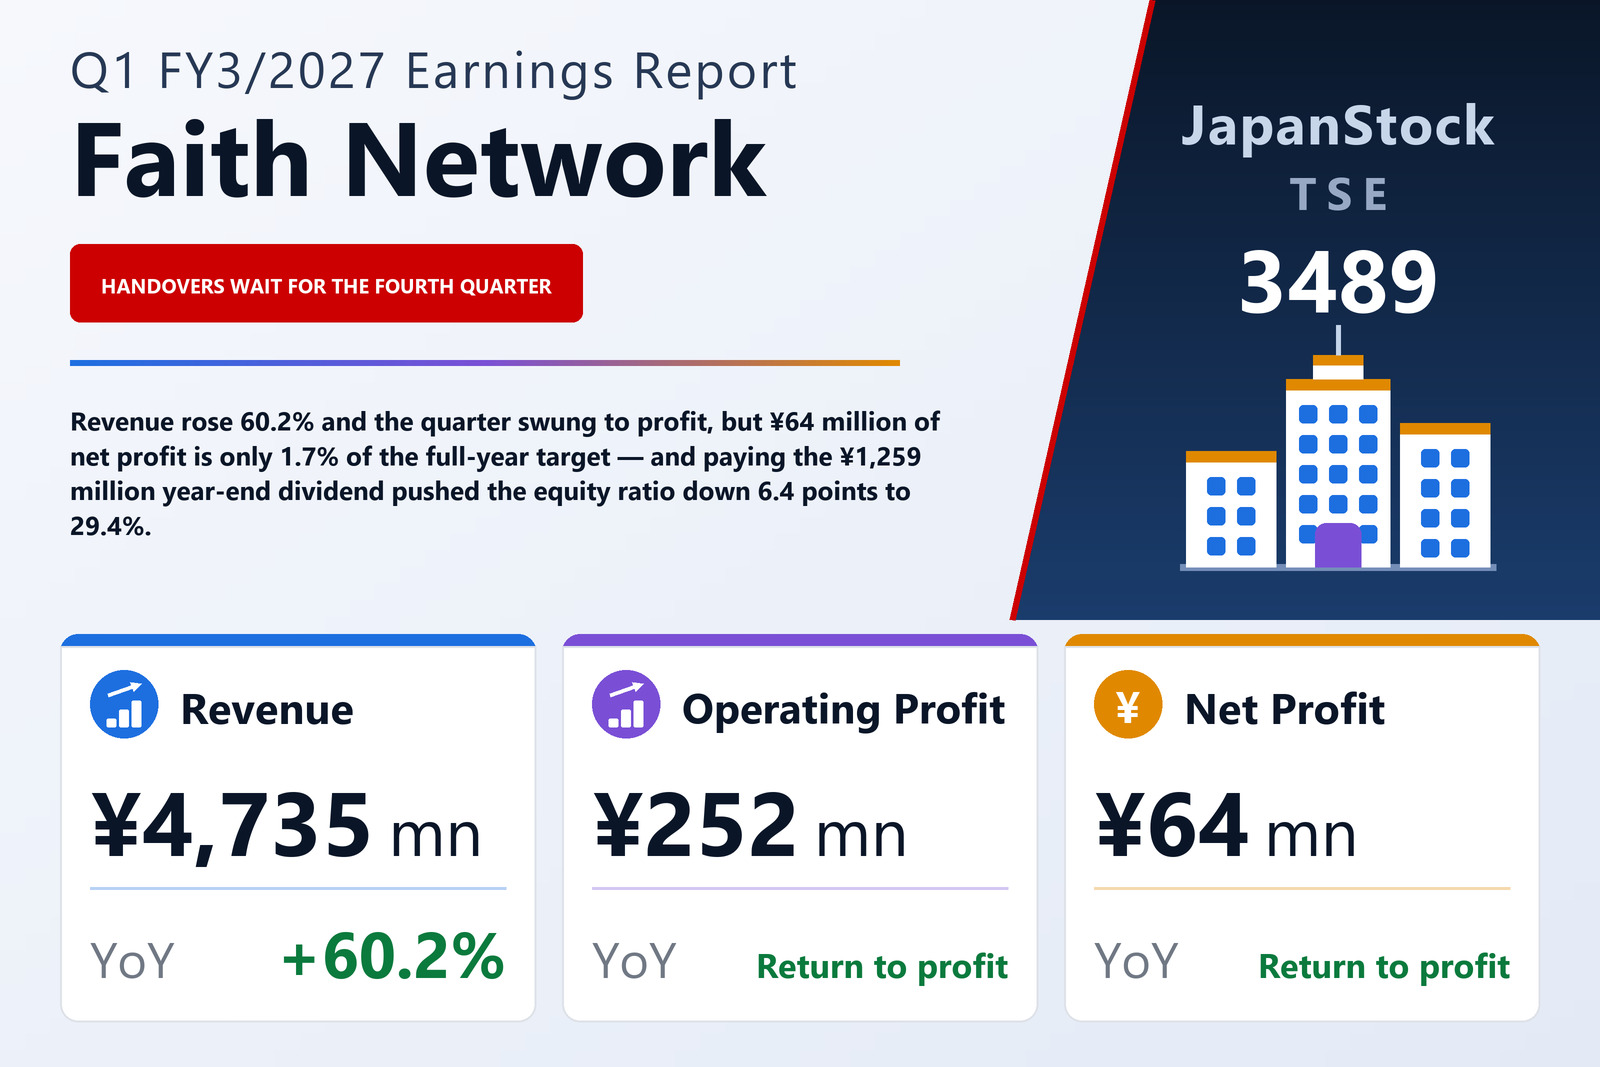
Three property sales and one construction job lift revenue 60%
Faith Network Co., Ltd. (TSE: 3489), a Tokyo developer that plans, builds and sells whole reinforced-concrete rental apartment buildings in the capital's Jonan wards, published consolidated results for the three months to June 30, 2026 on August 14, 2026 under Japanese GAAP. Revenue rose 60.2% to ¥4,735 million. The group swung to an operating profit of ¥252 million from a ¥46 million operating loss, to an ordinary profit of ¥117 million from a ¥148 million ordinary loss, and to net profit attributable to owners of the parent of ¥64 million from a ¥112 million loss. Basic earnings per share were ¥2.16 against a loss per share of ¥3.80. Comprehensive income of ¥64 million tracks net profit almost exactly, because the group's only item of other comprehensive income is a deferred hedge balance that moved by ¥14 thousand.
Almost all of the growth came from one of the two segments. Real Estate Investment Support — the planning, construction and sale of the group's own buildings — sold three real-estate products and one construction product in the quarter. Its revenue rose 66.0% to ¥4,495 million and it turned a ¥104 million segment loss into a ¥190 million segment profit. That one segment is 94.9% of group revenue. Real Estate Management, the recurring rental and building-management business, barely moved: revenue down 2.8% to ¥239 million and segment profit up 5.7% to ¥61 million. The filing states that segment profit is measured on the same basis as consolidated operating profit, so the two segments add straight to the group's ¥252 million with no unallocated corporate line in between.
Financing costs take more than half of the operating profit
Operating profit of ¥252 million became ordinary profit of ¥117 million, and the entire ¥135 million difference sits in the non-operating lines. Non-operating income was only ¥2 million — ¥2,399 thousand in full, of which a ¥2,000 thousand subsidy is the largest item. Non-operating expense was ¥137 million, or ¥137,704 thousand, and it is dominated by interest paid of ¥101,306 thousand, up from ¥83,128 thousand a year earlier, alongside ¥17,605 thousand of financing fees and ¥9,762 thousand of registration and licence tax. Interest alone absorbed 40.1% of operating profit, and the non-operating expense line 54.6% of it. Below that there is nothing unusual: the company reports no extraordinary items, so pre-tax profit equals ordinary profit, income taxes of ¥52,910 thousand take 45.2% of it, and ¥64,131 thousand is left for shareholders.
Inventory grew ¥5,727 million and borrowing paid for it
Total assets rose ¥3,422 million to ¥38,009 million in three months, and the company names the moving parts: real estate held for sale up ¥3,870 million, real estate for sale in progress up ¥1,856 million, and cash and deposits down ¥2,480 million. Put together, finished and work-in-progress development inventory went from ¥22,407 million to ¥28,134 million, which is 74.0% of the entire balance sheet, while cash fell from ¥9,140 million to ¥6,660 million. That is what a developer looks like when it is building toward a handover season it has not reached yet.
Liabilities rose ¥4,618 million to ¥26,818 million, and borrowings account for more than all of the increase, rising ¥6,142 million. Short-term borrowings went from ¥737 million to ¥3,178 million, the current portion of long-term borrowings from ¥4,651 million to ¥4,781 million, and long-term borrowings from ¥12,628 million to ¥16,199 million — total borrowings of ¥24,159 million against shareholders' equity of ¥11,191 million. Pulling the other way, income taxes payable fell ¥1,302 million to ¥8 million and advances received on uncompleted construction contracts fell ¥136 million. Bonds are small and shrinking, at ¥80 million against ¥105 million.
The dividend, not the trading, is why net assets fell
Net assets fell ¥1,195 million to ¥11,191 million in a quarter the group earned money, and the filing's own explanation is a two-item walk: retained earnings rose ¥64 million on the quarter's profit and fell ¥1,259 million on the dividend, taking them from ¥11,107 million to ¥9,912 million. Nothing else of size moved. Share capital and capital surplus are unchanged at ¥681 million and ¥653 million; treasury shares are unchanged at 237,693 shares and ¥54 million, so there was no buyback; and the company files the note on material changes in shareholders' equity as not applicable. That ¥1,259 million is the FY3/2026 year-end dividend of ¥42.50 a share on the 29,642,307 shares outstanding excluding treasury. Because net assets fell while total assets grew ¥3,422 million, the equity ratio dropped 6.4 points, from 35.8% to 29.4%. Shareholders' equity equals net assets here, because there are no non-controlling interests.
A first quarter worth 1.7% of the guided year
Full-year FY3/2027 guidance is unchanged from the forecast published with the FY3/2026 results on May 15, 2026: revenue of ¥37,000 million (+12.4%), operating profit of ¥6,300 million (+11.9%), ordinary profit of ¥5,800 million (+12.3%) and net profit of ¥3,800 million (+6.0%), for earnings per share of ¥128.20. Measured against those numbers, the first quarter delivered 12.8% of the revenue, 4.0% of the operating profit, 2.0% of the ordinary profit and 1.7% of the net profit. The company addresses that gap head-on rather than leaving it to the reader: its results depend heavily on when properties in the Real Estate Investment Support business are completed, completions and handovers are scheduled to concentrate in the fourth quarter of this fiscal year, and it states that the plan is progressing as intended. On this stock the quarterly run-rate carries almost no information; the handover schedule does.
The dividend forecast is unchanged as well: ¥45.00 a share for FY3/2027, paid entirely at the year-end, against ¥42.50 for FY3/2026 — a rise of 5.9% on the two stated figures, with no interim dividend on either side. Per-share numbers on both sides of the comparison follow a three-for-one common stock split effective October 1, 2025; the filing restates the prior year as though the split had happened at the start of that year, so the ¥2.16 and the ¥3.80 loss are directly comparable, as are the 29,880,000 shares issued. On the backdrop, the company cites Real Estate Economic Institute data: first-half 2026 condominium supply in the Tokyo metropolitan area fell 0.8% to 7,989 units, a fifth consecutive annual decline, while the average price rose 13.1% to ¥101.35 million, above ¥100 million for the first time, and the average price of owner-occupier condominiums in Tokyo's 23 wards reached ¥142.49 million. Faith Network's argument is that prices at that level push households toward renting and keep demand for investment-grade residences in its core wards firm.
| Metric | Q1 FY3/2027 | Q1 FY3/2026 | Change |
|---|---|---|---|
| Revenue (¥ million) | 4,735 | 2,954 | +60.2% |
| Operating profit (¥ million) | 252 | −46 | loss to profit |
| Ordinary profit (¥ million) | 117 | −148 | loss to profit |
| Net profit attrib. to owners of parent (¥ million) | 64 | −112 | loss to profit |
| Comprehensive income (¥ million) | 64 | −112 | loss to profit |
| EPS (¥) | 2.16 | −3.80 | loss to profit |
| Real Estate Investment Support — revenue (¥ million) | 4,495 | 2,708 | +66.0% |
| Real Estate Investment Support — segment profit (¥ million) | 190 | −104 | loss to profit |
| Real Estate Management — revenue (¥ million) | 239 | 246 | −2.8% |
| Real Estate Management — segment profit (¥ million) | 61 | 58 | +5.7% |
| Total assets (¥ million) | 38,009 | 34,587 | +9.9% |
| Net assets (¥ million) | 11,191 | 12,387 | −9.7% |
| Equity ratio | 29.4% | 35.8% | −6.4 pt |
| FY3/2027 guidance — revenue (¥ million) | 37,000 | — | +12.4% |
| FY3/2027 guidance — operating profit (¥ million) | 6,300 | — | +11.9% |
| FY3/2027 guidance — ordinary profit (¥ million) | 5,800 | — | +12.3% |
| FY3/2027 guidance — net profit (¥ million) | 3,800 | — | +6.0% |
| FY3/2027 guidance — EPS (¥) | 128.20 | — | n.m. |
| Annual dividend per share (¥) | 45.00 | 42.50 | +5.9% |
JapanStockPulse provides informational content only and does not constitute investment advice. Figures are taken from the company's published earnings short report and may be subject to subsequent revision.