The GPU cloud has moved from cost to contributor
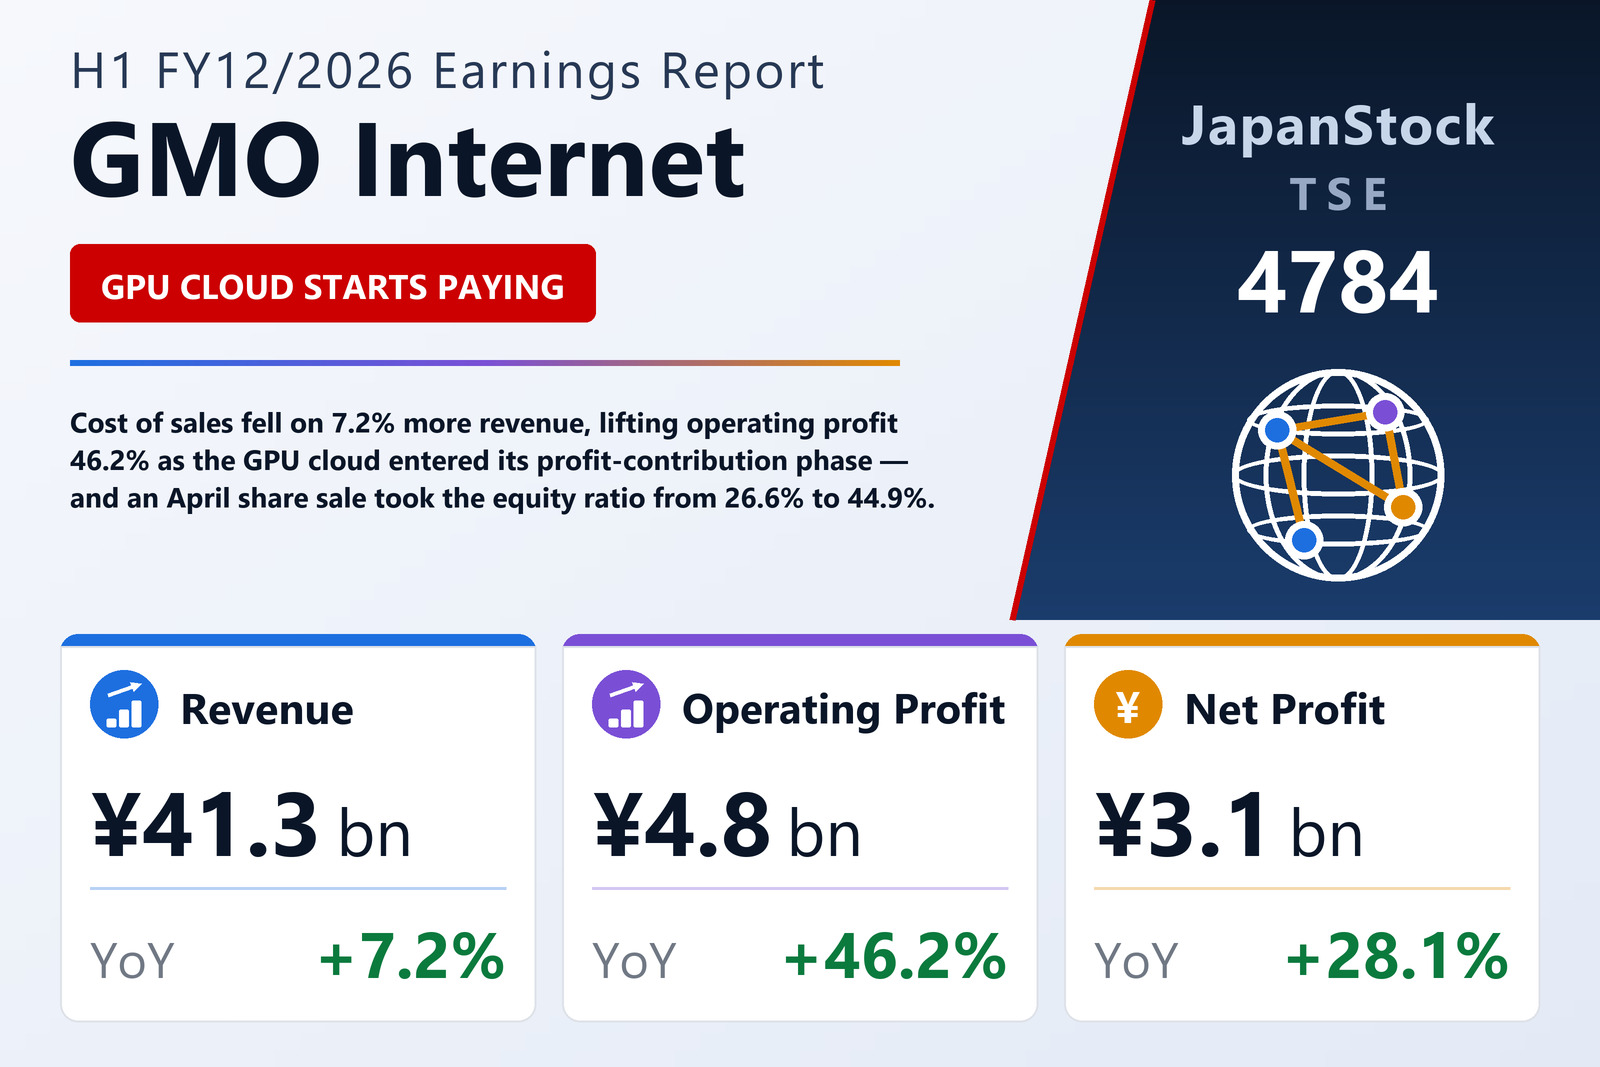
GMO Internet, Inc. (TSE: 4784), the Tokyo-listed operator of domain registration, hosting, internet-access and GPU-cloud services inside the GMO Internet Group, published consolidated results for the six months to June 30, 2026 on August 14, 2026 under Japanese GAAP. Revenue rose 7.2% to ¥41,279 million, operating profit 46.2% to ¥4,765 million, ordinary profit 39.5% to ¥4,543 million and interim profit attributable to owners of the parent 28.1% to ¥3,088 million, for basic earnings per share of ¥10.83 against ¥8.79. Comprehensive income was ¥3,006 million, up 16.5% — slightly below the ¥3,078 million of interim profit, because ¥109 million of unrealised losses on securities outweighed ¥38 million of favourable currency translation.
Internet Infrastructure — domains, servers, internet access and the GPU cloud, plus the overseas infrastructure business run under the Z.com brand in Vietnam, Thailand and other Asian markets — grew revenue 12.2% to ¥35,885 million and segment profit 27.0% to ¥4,539 million. That is 86.0% of the ¥41,711 million reporting-segment revenue total and 92.2% of the ¥4,923 million of segment profit. The established lines held up, with the access business concentrating on own-brand products led by GMO とくとくBB (GMO Tokutoku BB) and optimising sales mix to strengthen recurring revenue. The new line is what changed the shape of the half: GMO GPU Cloud turned profitable on a standalone basis in the fourth quarter of FY12/2025 and has now, the company says, entered a profit-contribution phase while running at a high utilisation rate. The board approved ¥6.9 billion to add 42 NVIDIA B300 units on April 10, 2026, for installation from August 2026, and the company cites a Fuji Chimera Research forecast of a 39% compound annual growth rate in the data-centre GPU-server market from 2024 to 2029. It names a strategic partnership with Turing Inc. and a sales-partner agreement with ITOCHU Techno-Solutions (CTC) as the routes to broader industry adoption. A second resolution on August 10, 2026, disclosed here as a subsequent event, commits a further ¥10.1 billion of GPU servers and peripheral equipment for installation from January 2027; the company judges the effect of both on FY12/2026 consolidated results to be minor.
Cost of sales did not move, and that is the whole margin story
Revenue grew ¥2,773 million while cost of sales fell ¥65 million, from ¥25,877 million to ¥25,812 million — down 0.3% against 7.2% more revenue. Gross profit therefore rose 22.5% to ¥15,467 million and the gross margin from 32.8% to 37.5%. Selling, general and administrative expenses rose 14.2% to ¥10,701 million, well behind gross profit, so the operating margin widened from 8.5% to 11.5%. Below the operating line the direction reverses. Net non-operating items swung from −¥4 million to −¥223 million: non-operating income fell from ¥125 million to ¥52 million as a ¥48 million foreign-exchange gain became a ¥20 million loss, while non-operating expenses rose from ¥129 million to ¥275 million on ¥124 million of share-issuance costs from the April offering and interest expense up from ¥79 million to ¥98 million. That is why ordinary profit grew 39.5% where operating profit grew 46.2%. Pre-tax profit rose only 34.2%, to ¥4,543 million from ¥3,385 million, because the prior half carried extraordinary items this one does not — a ¥1,925 million government subsidy against a ¥1,795 million asset-reduction loss. Tax expense of ¥1,465 million was 32.2% of pre-tax profit against 29.3% a year earlier, and a ¥10 million loss attributable to non-controlling interests lifted the parent's share above group net profit.
The balance sheet grew on new equity, not on earnings
Total assets rose 46.0%, from ¥51,528 million to ¥75,239 million, and net assets 143.9%, from ¥14,069 million to ¥34,316 million. Almost none of that came from trading. The company carried out a new share issuance and secondary offering in April 2026: a public offering of 30,000,000 shares, paid in on April 27, added ¥10,191 million each to stated capital and to capital reserve, raised capital surplus by ¥10,094 million and brought in ¥20,259 million of cash. Retained earnings actually fell ¥109 million, the ¥3,088 million of interim profit being more than absorbed by ¥3,197 million of dividends. Equity attributable to owners went from ¥13,686 million to ¥33,782 million and the equity ratio from 26.6% to 44.9%, a gain of 18.3 points. The company gives four purposes for the raise: funding capital investment in the GPU-cloud business, compliance with the Tokyo Stock Exchange Prime market's listing-maintenance criteria, improved liquidity, and a broader shareholder base weighted toward retail investors. It states that it satisfied the tradable-share-ratio criterion and completed compliance with all of the Prime market's listing-maintenance criteria as of April 28, 2026.
The money is visible on the asset side but not yet in fixed assets. Cash and deposits rose ¥19,604 million to ¥33,493 million and investment securities ¥4,061 million to ¥5,078 million, while tangible fixed assets rose only ¥885 million to ¥10,086 million — inside which lease assets rose ¥1,921 million to ¥4,706 million as buildings and equipment declined. Purchases of tangible fixed assets in the cash flow statement came to just ¥102 million, against ¥4,232 million spent on investment securities and ¥449 million on intangibles, so the additions to productive capacity are arriving as leased assets rather than as outright purchases. Liabilities rose ¥3,463 million to ¥40,922 million, mainly ¥5,000 million of new short-term borrowings and ¥2,173 million more lease obligations, offset by a ¥742 million fall in income taxes payable.
The share count is why the per-share line lags the profit line. Shares outstanding went from 274,698,528 to 304,698,528, and the weighted average for the half from 274,164,470 to 285,020,505 — up 4.0%, even though the new shares were on the register for barely two of the six months. Profit attributable to owners rose 28.1%, but earnings per share only 23.2%, from ¥8.79 to ¥10.83. The gap widens from here: the company's full-year guidance of ¥20.05 per share is struck on the whole 30,000,000-share increment, not on a part-period weighting. No diluted figure is disclosed for the current half; the prior half showed ¥8.77.
Advertising sold less and earned six times as much
Internet Advertising and Media did the opposite of the infrastructure business on both lines: revenue fell 14.4% to ¥5,826 million while segment profit rose 476.4%, to ¥383 million from ¥66 million, taking the segment margin from 1.0% to 6.6%. The company attributes the revenue decline to a structural change in the industry — advertisers bringing marketing in-house — and the profit recovery to organisational restructuring, principally the redeployment of staff to optimise the group-wide structure. The segment is also being pointed at the infrastructure customer base: alongside the GMO SSP delivery platform and its own web media, the group now sells customer-acquisition support to companies that have already bought a domain, led by the AI-based web marketing tool GMO AIかんたん集客 (GMO AI Kantan Shukyaku) covering SEO, social-media operation and article production, with the explicit aim of converting one-off sales into recurring revenue. On the market itself the company cites Dentsu's estimate that Japanese internet advertising spend reached ¥4.0459 trillion in 2025, up 10.8% — the first time above ¥4 trillion and, at 50.2% of total advertising spend, the first time above half.
Half the year is banked and guidance has not moved
Full-year FY12/2026 guidance is unchanged from the February 12, 2026 forecast: revenue of ¥82,000 million (+4.4%), operating profit of ¥9,460 million (+15.0%), ordinary profit of ¥9,100 million (+9.0%) and profit attributable to owners of ¥5,900 million (+6.1%), for earnings per share of ¥20.05. The half banked ¥3,088 million of that ¥5,900 million — 52.3% — with revenue at 50.3% and operating profit at 50.4% of their full-year marks. The arithmetic leaves an implied second half of ¥40,721 million of revenue, ¥4,695 million of operating profit and ¥2,812 million of attributable profit: each slightly below the half just reported, which is a conservative shape for a business that has just committed ¥17.0 billion to new capacity. The annual dividend forecast is ¥21.51, up 6.2% from ¥20.26, and is unrevised; only the annual amount is forecast, with payment made quarterly, and ¥6.02 and ¥4.85 have already been declared for the first and second quarters. Every quarterly dividend paid for FY12/2025 and both declared so far for FY12/2026 include a commemorative component — ¥7.06 of last year's ¥20.26, and ¥3.77 of the ¥10.87 declared to date. Payment of the interim dividend is due to start on September 24, 2026. Operating cash flow was ¥3,681 million against ¥6,297 million a year earlier, held back by ¥2,399 million of tax paid; the investing outflow widened to ¥4,697 million from ¥69 million and financing turned to an inflow of ¥20,674 million from an outflow of ¥2,361 million. Cash and equivalents closed at ¥33,487 million, up ¥19,657 million. There was no change in the scope of consolidation and no change in accounting policy, and as an interim tanshin the statements are not subject to audit review.
| Metric | H1 FY12/2026 | H1 FY12/2025 | Change |
|---|---|---|---|
| Revenue (¥ million) | 41,279 | 38,506 | +7.2% |
| Cost of sales (¥ million) | 25,812 | 25,877 | −0.3% |
| Gross profit (¥ million) | 15,467 | 12,628 | +22.5% |
| Gross margin | 37.5% | 32.8% | +4.7 pt |
| SG&A expenses (¥ million) | 10,701 | 9,368 | +14.2% |
| Operating profit (¥ million) | 4,765 | 3,260 | +46.2% |
| Operating margin | 11.5% | 8.5% | +3.1 pt |
| Ordinary profit (¥ million) | 4,543 | 3,256 | +39.5% |
| Pre-tax profit (¥ million) | 4,543 | 3,385 | +34.2% |
| Net profit attrib. to owners of parent (¥ million) | 3,088 | 2,410 | +28.1% |
| Comprehensive income (¥ million) | 3,006 | 2,581 | +16.5% |
| EPS (¥) | 10.83 | 8.79 | +23.2% |
| Internet Infrastructure — revenue (¥ million) | 35,885 | 31,976 | +12.2% |
| Internet Infrastructure — segment profit (¥ million) | 4,539 | 3,574 | +27.0% |
| Internet Advertising and Media — revenue (¥ million) | 5,826 | 6,805 | −14.4% |
| Internet Advertising and Media — segment profit (¥ million) | 383 | 66 | +476.4% |
| Total assets (¥ million) | 75,239 | 51,528 | +46.0% |
| Net assets (¥ million) | 34,316 | 14,069 | +143.9% |
| Shareholders' equity (¥ million) | 33,782 | 13,686 | +146.8% |
| Equity ratio | 44.9% | 26.6% | +18.3 pt |
| FY12/2026 guidance — revenue (¥ million) | 82,000 | — | +4.4% |
| FY12/2026 guidance — operating profit (¥ million) | 9,460 | — | +15.0% |
| FY12/2026 guidance — ordinary profit (¥ million) | 9,100 | — | +9.0% |
| FY12/2026 guidance — net profit (¥ million) | 5,900 | — | +6.1% |
| FY12/2026 guidance — EPS (¥) | 20.05 | — | n.m. |
| Annual dividend per share (¥) | 21.51 | 20.26 | +6.2% |
JapanStockPulse provides informational content only and does not constitute investment advice. Figures are taken from the company's published earnings short report and may be subject to subsequent revision.