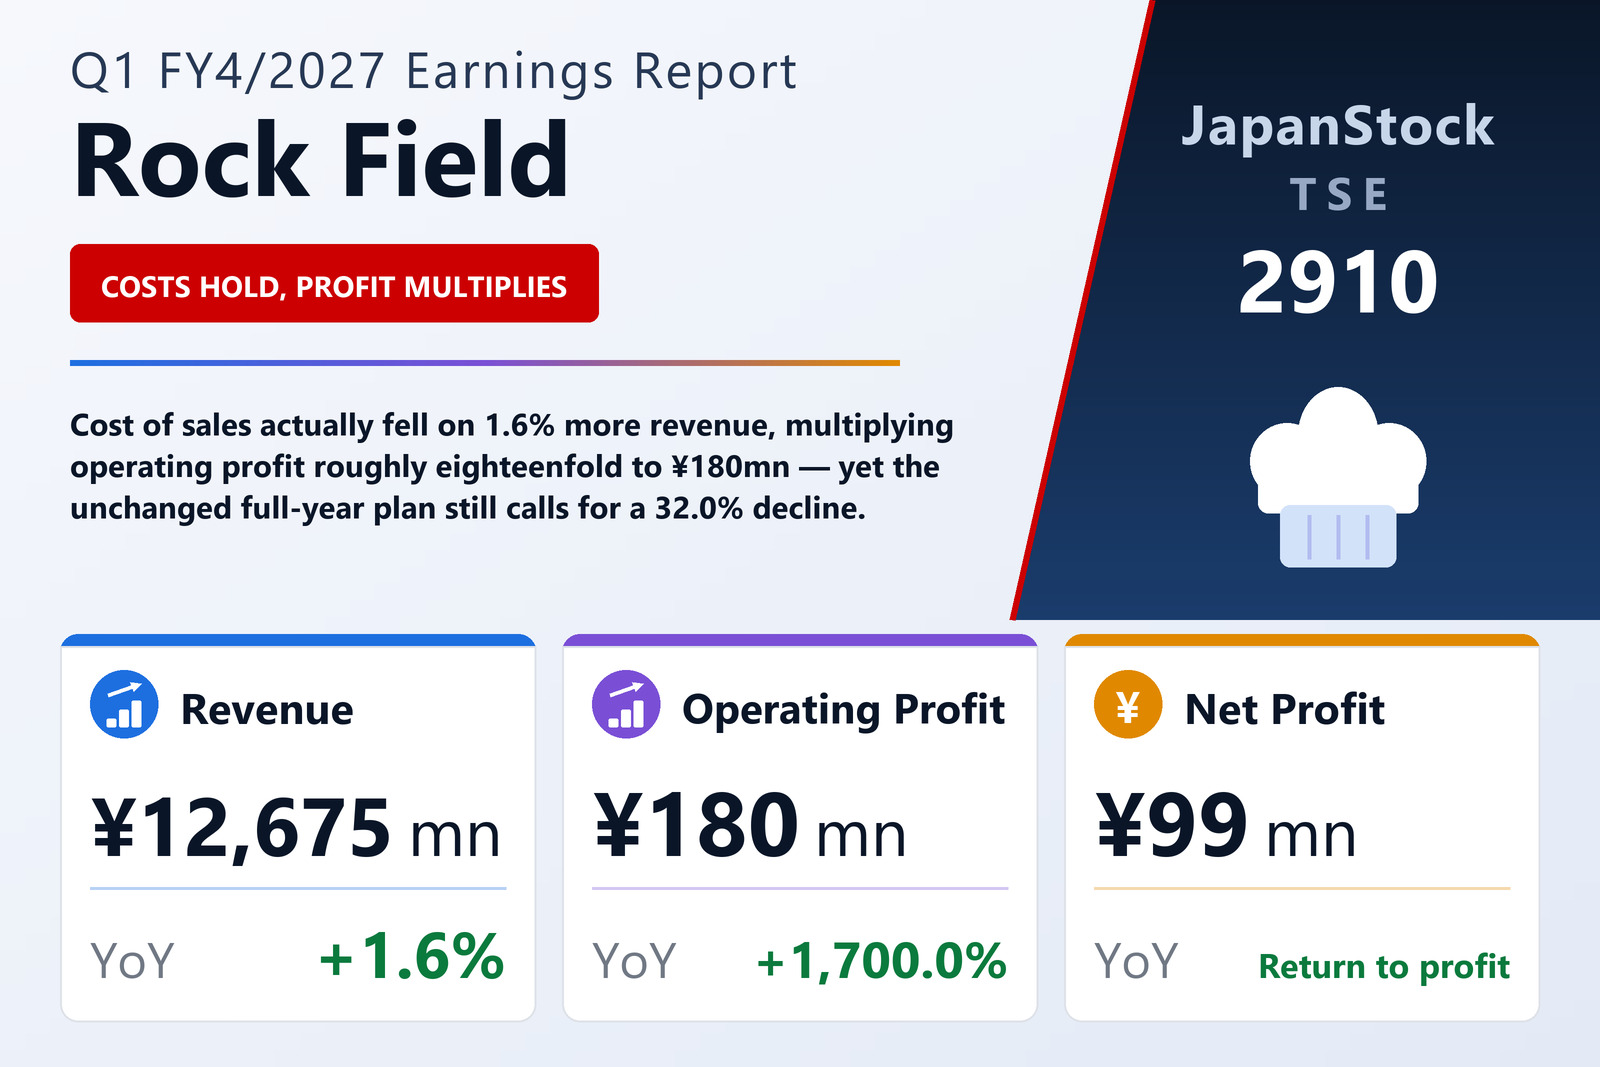
Cost held flat while sales grew, and the whole profit swing sits in that gap
Rock Field Co., Ltd. (TSE: 2910), the Kobe-based prepared-foods maker whose RF1 salad counters and 神戸コロッケ (Kobe Korokke) croquette stands occupy department-store and station food halls, published consolidated results for the first quarter of FY4/2027 — the three months from May 1 to July 31, 2026 — on September 4, 2026 under Japanese GAAP. Revenue rose 1.6% to ¥12,675 million. Operating profit climbed from ¥10 million to ¥180 million, ordinary profit 383.5% to ¥206 million, and net profit attributable to owners of the parent came to ¥99 million against a ¥10 million loss a year earlier. Earnings per share were ¥3.80 against a ¥0.41 loss, and comprehensive income was ¥223 million, up 550.4%.
The mechanism is visible in three lines of the income statement. Revenue added ¥204 million, but the cost of sales fell, from ¥5,350 million to ¥5,342 million, so gross profit rose 3.0% to ¥7,332 million and the gross margin widened to 57.8% from 57.1%. Selling, general and administrative expenses grew only 0.6% to ¥7,152 million. A ¥212 million gain in gross profit against a ¥43 million rise in overheads accounts, to within the filing's rounding, for the entire ¥170 million operating-profit swing. The company describes what produced it as a review of product design and selling prices together with improvements in store operating efficiency, undertaken in the second year of the phase-two medium-term plan toward its "Vision 2030" goals, alongside a reorganisation that strengthened its management-strategy and human-resources functions. It also says the prepared-foods sector remains difficult, with raw-material and labour costs rising and inflation keeping consumers thrift-minded.
Salads shrank; the growth came from the rest of the counter
The group reports a single segment, prepared foods, and therefore publishes no segment table — but it does break sales out by retail format. RF1, the largest at 61.7% of sales, grew 2.2% to ¥7,815 million, yet its two signature lines went backwards: salads fell 1.1% to ¥3,956 million and fried items 1.4% to ¥1,547 million. All of RF1's growth, and most of the group's, came from its other prepared foods, up 11.2% to ¥2,311 million. Elsewhere グリーン・グルメ (Green Gourmet) rose 0.6% to ¥2,408 million, いとはん (Itohan) 3.2% to ¥944 million and wholesale 16.5% to ¥245 million, while 神戸コロッケ was flat at ¥717 million, 融合 (Yugo) fell 9.9% to ¥217 million and ベジテリア (Vegeteria) 14.5% to ¥189 million. A new format, Umi & Yama Kitchen, contributed ¥16 million. For 神戸コロッケ the company ran pop-up events at East Japan Railway stations to open new locations and test a light-equipment format, and says it intends to build efficient delivery routes and operations from that toward permanent stores.
A smaller balance sheet, and a quarter that consumed cash
Total assets fell ¥592 million to ¥34,274 million. Cash and deposits dropped ¥1,130 million while accounts receivable rose ¥461 million and inventories ¥116 million. Liabilities fell ¥423 million to ¥5,830 million, mostly the ¥472 million unwinding of the bonus provision and a ¥160 million fall in accrued income taxes. Net assets fell ¥168 million to ¥28,444 million: retained earnings gave up ¥392 million to fund the dividend and took back ¥99 million from the quarter's profit, while the valuation difference on available-for-sale securities added ¥116 million. Because assets shrank faster than equity, the equity ratio rose to 83.0% from 82.1% — total borrowings are ¥250 million against ¥28,444 million of net assets — while net assets per share eased to ¥1,088.12 from ¥1,094.58. Operating cash flow was an outflow of ¥371 million against an outflow of ¥142 million a year earlier, investing an outflow of ¥294 million and financing an outflow of ¥485 million, leaving cash and equivalents at ¥11,604 million, down ¥1,150 million.
Guidance left untouched implies the rest of the year gives the gain back
Guidance is unchanged from the forecast published on June 10, 2026. For the first half the company expects revenue of ¥25,542 million (+1.9%), operating profit of ¥176 million (+109.9%), ordinary profit of ¥213 million (+94.3%) and net profit of ¥103 million, for earnings per share of ¥3.95. For the full year it expects revenue of ¥52,160 million (+2.1%), operating profit of ¥531 million, down 32.0%, ordinary profit of ¥582 million (−27.2%) and net profit of ¥313 million (+216.4%), for earnings per share of ¥11.98. Three pieces of arithmetic follow from leaving those numbers in place. The quarter's ¥180 million already exceeds the ¥176 million half-year operating-profit forecast, so the second quarter is implied to run a small operating loss of about ¥4 million. The first quarter has delivered 33.9% of the full-year operating-profit plan. And that plan is still 32.0% below last year, leaving ¥351 million to be earned across the remaining nine months. The filing does not reconcile the quarter with the year; it says only that a revision will be disclosed promptly if a material divergence emerges. The annual dividend is held at ¥24.00 — ¥9.00 interim and ¥15.00 final, the same split as FY4/2026.
| Metric | Q1 FY4/2027 | Q1 FY4/2026 | Change |
|---|---|---|---|
| Revenue (¥ million) | 12,675 | 12,471 | +1.6% |
| Gross profit (¥ million) | 7,332 | 7,120 | +3.0% |
| SG&A expenses (¥ million) | 7,152 | 7,109 | +0.6% |
| Operating profit (¥ million) | 180 | 10 | n.m. |
| Operating margin | 1.4% | 0.1% | +1.3 pt |
| Ordinary profit (¥ million) | 206 | 42 | +383.5% |
| Pre-tax profit (¥ million) | 199 | 25 | +696.0% |
| Net profit attrib. to owners of parent (¥ million) | 99 | −10 | loss to profit |
| Comprehensive income (¥ million) | 223 | 34 | +550.4% |
| EPS (¥) | 3.80 | −0.41 | loss to profit |
| Total assets (¥ million) | 34,274 | 34,866 | −1.7% |
| Net assets (¥ million) | 28,444 | 28,612 | −0.6% |
| Equity ratio | 83.0% | 82.1% | +0.9 pt |
| FY4/2027 guidance — revenue (¥ million) | 52,160 | — | +2.1% |
| FY4/2027 guidance — operating profit (¥ million) | 531 | — | −32.0% |
| FY4/2027 guidance — ordinary profit (¥ million) | 582 | — | −27.2% |
| FY4/2027 guidance — net profit (¥ million) | 313 | — | +216.4% |
| FY4/2027 guidance — EPS (¥) | 11.98 | — | n.m. |
| Annual dividend per share (¥) | 24.00 | 24.00 | unchanged |
JapanStockPulse provides informational content only and does not constitute investment advice. Figures are taken from the company's published earnings short report and may be subject to subsequent revision.