A second straight year of falling revenue
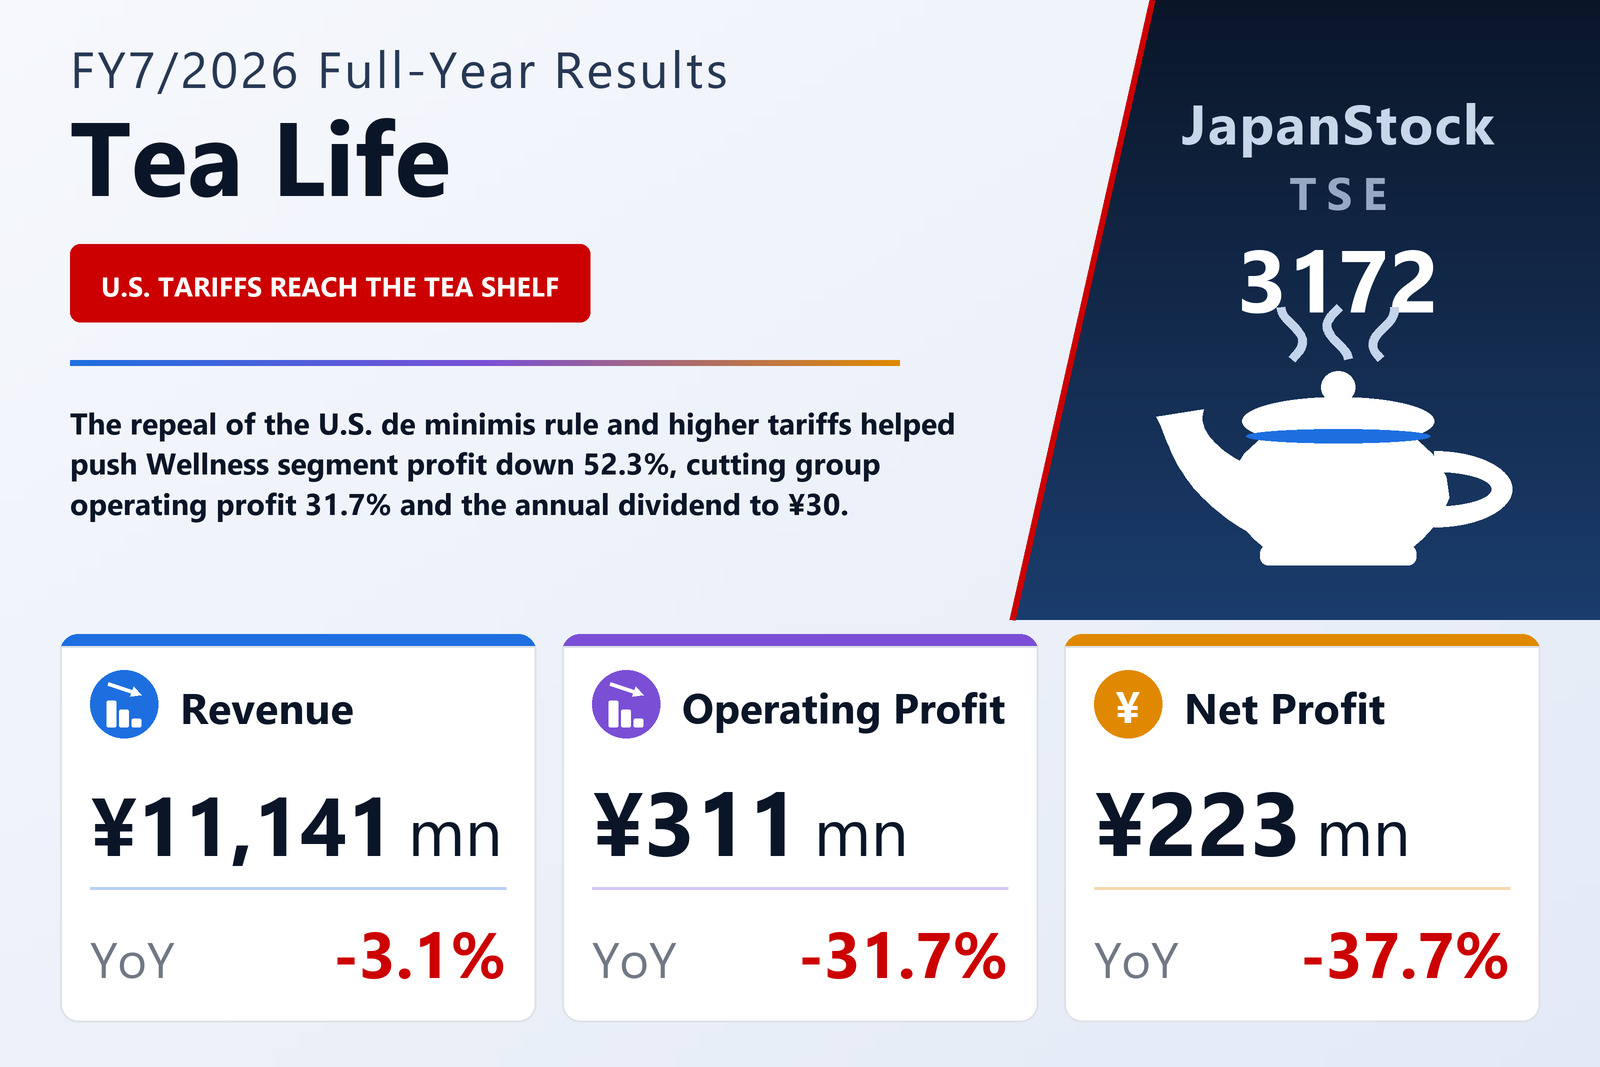
Tea Life Co., Ltd. (TSE: 3172), which sells health teas, health foods, cosmetics, baby goods and children's furniture by mail order and online and also rents out its own property and takes on outsourced shipping work, published consolidated results for the year to July 31, 2026 on September 4, 2026 under Japanese GAAP. Revenue fell 3.1% to ¥11,141 million, a second consecutive decline after the 11.5% drop of the year before. Operating profit fell 31.7% to ¥311 million, ordinary profit 29.8% to ¥318 million and net profit attributable to owners of parent 37.7% to ¥223 million, for earnings per share of ¥52.34 against ¥84.09. Return on equity fell to 3.5% from 5.6%, and comprehensive income to ¥219 million from ¥322 million.
The margin story is not the revenue story. Gross profit fell only 1.0% to ¥4,078 million and the gross margin actually improved, to 36.6% from 35.8%, as the company passed raw-material cost increases through into prices. What took the operating line down was cost below that: SG&A rose 2.8% to ¥3,766 million against a shrinking top line. Packing and shipping alone rose 19.9% to ¥608 million from ¥507 million, while advertising was little changed at ¥1,077 million against ¥1,066 million. The operating margin fell to 2.8% from 4.0%.
Below the operating line the year was slightly kinder, then harsher. Non-operating income of ¥22 million against expenses of ¥16 million left ordinary profit falling less than operating profit, helped by interest income of ¥16 million against ¥5 million a year earlier. Extraordinary items ran the other way: ¥8 million of gains against ¥41 million of losses, including a ¥38 million impairment — ¥14 million of goodwill, ¥17 million of intangibles and ¥6 million of deferred assets written down on reduced profitability. Pre-tax profit was ¥284 million and the tax charge ¥61 million.
Wellness: a U.S. rule change lands on a segment already shrinking
Wellness, which supplies more than nine-tenths of group revenue, saw sales fall 3.6% to ¥10,189 million and segment profit more than halve, down 52.3% to ¥127 million. The company names four causes on the revenue side: slowing growth in TV shopping, a shrinking catalogue mail-order market overall, intensifying competition as more sellers open on e-commerce malls, and — the one that will matter most to readers outside Japan — the abolition of the de minimis duty-free threshold on goods imported into the United States, together with higher U.S. tariffs. On the profit side it names cost push in raw materials and delivery, plus the expense of up-front investment in the U.S. market.
The segment was not standing still. Wholesale to TV shopping pushed existing mainstay products and worked on new ones; wholesale to physical stores pushed kitchen lines and new gift products; catalogue mail order improved the efficiency of customer acquisition, right-sized promotional spending and passed raw-material cost rises into prices; and the domestic and overseas e-commerce operations optimised running costs, widened the own-brand range and brought inventory back to size. The company also says it worked on both suppliers and buyers for exports of matcha and Japanese-made foods, whose popularity overseas is rising.
Logistics, which uses the group's own property to rent space and take on shipping work for others, grew revenue 2.7% to ¥952 million on better utilisation at the Fukuroi, Kakegawa and Nagoya centres and on new customer acquisition. Segment profit still slipped 2.8% to ¥184 million: efficiency-led centre operation cut personnel costs and utility cost increases were passed on, but the company booked an asset retirement obligation at the Nagoya centre. The filing notes that segment revenue is stated after elimination of inter-segment transactions while segment profit is stated before it.
A 75.6% equity ratio, and cash down ¥678 million
Total assets fell 1.9% to ¥8,612 million, down ¥165 million. Current assets were essentially flat, up ¥6 million — receivables up ¥107 million and merchandise up ¥44 million against cash down ¥175 million — while non-current assets fell ¥162 million as investment securities dropped ¥100 million and goodwill ¥45 million, outweighing increases in land of ¥42 million and in long-term deferred tax assets of ¥55 million. Liabilities fell ¥242 million to ¥2,102 million, with the shape of the debt changing more than its size: ¥591 million of long-term borrowings moved out of non-current liabilities and the current portion rose ¥491 million. Net assets rose ¥76 million to ¥6,509 million on retained earnings, and the equity ratio improved to 75.6% from 73.3%, with net assets per share of ¥1,523.27.
Cash flow is where the year shows. Operating cash flow collapsed 83.5% to ¥87 million from ¥526 million, pre-tax profit of ¥284 million being largely absorbed by ¥168 million of tax paid. Investing used ¥513 million, dominated by ¥2,100 million placed into time deposits against ¥1,600 million withdrawn, alongside ¥129 million of securities redemptions, ¥113 million of property purchases and ¥59 million of investment securities bought. Financing used ¥249 million: ¥149 million of dividends and ¥99 million of debt repayment. Cash and equivalents ended the year at ¥1,955 million, down ¥678 million.
Guidance rebuilds the profit; the dividend does not follow
For FY7/2027 the company guides revenue of ¥11,363 million (+2.0%), operating profit of ¥437 million (+40.4%), ordinary profit of ¥428 million (+34.7%) and net profit of ¥279 million (+25.0%), for earnings per share of ¥65.32 — and says that forecast already absorbs the closure of the Nagoya centre, whose fixed-term building lease expires. It sits inside a three-year mid-term plan running from August 2025 to July 2028 under the slogan “Mastering Today, Shaping Our Future”, in which the overseas business centred on North America is to be run at minimum scale until the export and tariff environment settles. Beyond that, the filing offers no bridge from a 31.7% profit decline to a 40.4% recovery.
The dividend was cut. FY7/2026 pays ¥15.00 interim and ¥15.00 final, ¥30.00 in all against ¥40.00 a year earlier, a reduction of 25.0% — yet because profit fell faster still, the consolidated payout ratio rose to 66.8% from 47.6%, more than double the roughly 30% the company states as its standing policy. FY7/2027 is guided at the same ¥30.00, split ¥15.00 and ¥15.00, which on guided earnings would be a 45.9% payout. The company reports no material subsequent events.
| Metric | FY7/2026 | FY7/2025 | Change |
|---|---|---|---|
| Revenue (¥ million) | 11,141 | 11,502 | −3.1% |
| Gross profit (¥ million) | 4,078 | 4,121 | −1.0% |
| Gross margin | 36.6% | 35.8% | +0.8 pt |
| SG&A expenses (¥ million) | 3,766 | 3,665 | +2.8% |
| Operating profit (¥ million) | 311 | 456 | −31.7% |
| Operating margin | 2.8% | 4.0% | −1.2 pt |
| Ordinary profit (¥ million) | 318 | 453 | −29.8% |
| Net profit attrib. to owners of parent (¥ million) | 223 | 358 | −37.7% |
| Comprehensive income (¥ million) | 219 | 322 | −31.9% |
| EPS (¥) | 52.34 | 84.09 | −37.8% |
| Return on equity | 3.5% | 5.6% | −2.1 pt |
| Wellness — revenue (¥ million) | 10,189 | 10,574 | −3.6% |
| Wellness — segment profit (¥ million) | 127 | 266 | −52.3% |
| Logistics — revenue (¥ million) | 952 | 927 | +2.7% |
| Logistics — segment profit (¥ million) | 184 | 189 | −2.8% |
| Total assets (¥ million) | 8,612 | 8,777 | −1.9% |
| Total liabilities (¥ million) | 2,102 | 2,344 | −10.3% |
| Net assets (¥ million) | 6,509 | 6,432 | +1.2% |
| Equity ratio | 75.6% | 73.3% | +2.3 pt |
| Net assets per share (¥) | 1,523.27 | 1,507.29 | +1.1% |
| Operating cash flow (¥ million) | 87 | 526 | −83.5% |
| Cash and equivalents at year end (¥ million) | 1,955 | 2,633 | −25.8% |
| FY7/2027 guidance — revenue (¥ million) | 11,363 | — | +2.0% |
| FY7/2027 guidance — operating profit (¥ million) | 437 | — | +40.4% |
| FY7/2027 guidance — ordinary profit (¥ million) | 428 | — | +34.7% |
| FY7/2027 guidance — net profit (¥ million) | 279 | — | +25.0% |
| FY7/2027 guidance — EPS (¥) | 65.32 | — | +24.8% |
| Annual dividend per share (¥) | 30.00 | 30.00 | unchanged |
| Annual dividend per share, FY7/2026 vs FY7/2025 (¥) | 30.00 | 40.00 | −25.0% |
| Consolidated payout ratio, FY7/2026 vs FY7/2025 | 66.8% | 47.6% | +19.2 pt |
JapanStockPulse provides informational content only and does not constitute investment advice. Figures are taken from the company's published earnings short report and may be subject to subsequent revision.