The same crypto price fall lifted one profit line and sank the other
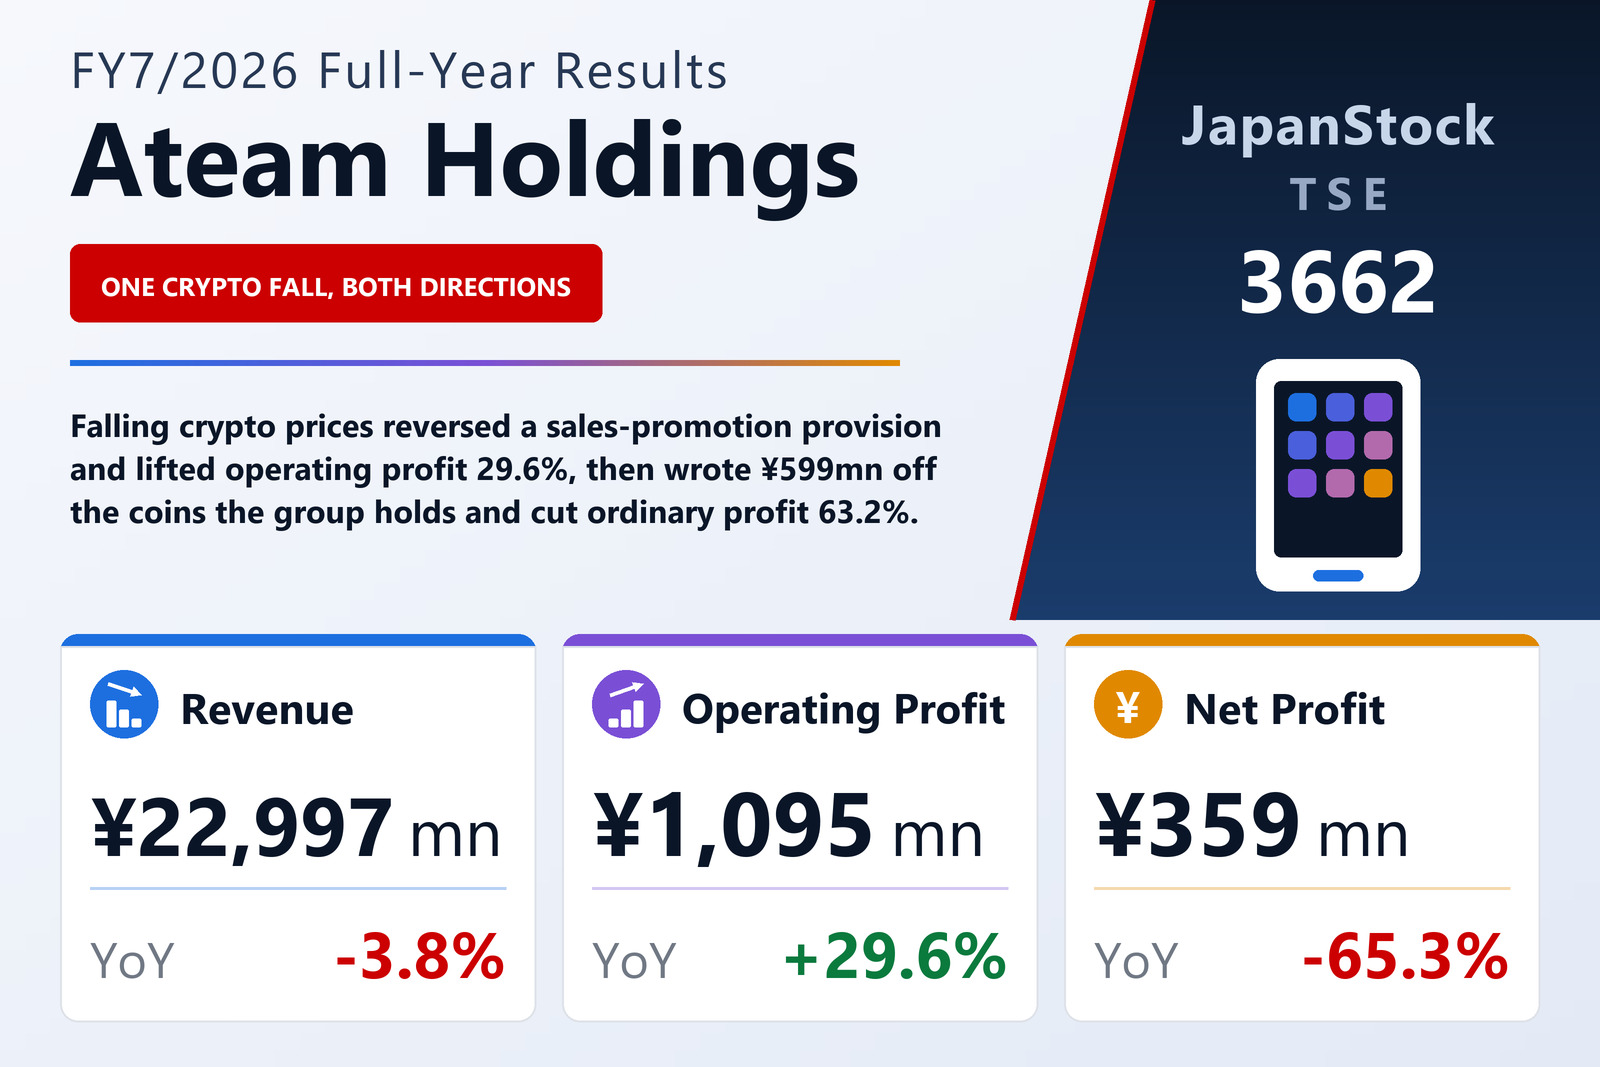
Ateam Holdings Co., Ltd. (TSE: 3662), the Nagoya-based internet group that runs comparison and information media, direct-to-consumer e-commerce and mobile games, published consolidated results for the year to July 31, 2026 on September 4, 2026 under Japanese GAAP. Revenue fell 3.8% to ¥22,997 million while operating profit rose 29.6% to ¥1,095 million, lifting the operating margin to 4.8% from 3.5%. Below that line the direction reverses: ordinary profit fell 63.2% to ¥584 million and net profit attributable to owners of parent 65.3% to ¥359 million, for earnings per share of ¥19.36 against ¥55.75 and diluted earnings per share of ¥17.45. Comprehensive income was ¥347 million, down 47.3%.
Both moves have the same cause, and the filing says so. Paddle (株式会社Paddle), consolidated since November 2024, runs a points application whose points are exchangeable for crypto-assets, so the group carries a sales-promotion provision against those points and holds the coins themselves. Falling crypto prices produced a reversal of that provision, which is the reason the company gives for operating profit rising; the same fall produced a valuation loss on the coins, which is the reason it gives for ordinary profit and net profit falling. The group's two EBITDA measures split for the same reason. EBITDA — operating profit plus depreciation, including amortisation of intangibles other than goodwill, plus goodwill amortisation — rose 18.3% to ¥1,506 million. Adjusted EBITDA, defined as EBITDA plus M&A-related costs, plus the sales-promotion provision charge and promotion expenses, less the crypto-asset equivalent of the points granted, fell 36.0% to ¥1,100 million — landing ¥406 million below EBITDA where last year it sat ¥446 million above it. The company also cites higher shareholder-benefit costs as the number of qualifying shareholders grew, and higher common costs from executing the mid-term plan.
Below the operating line, a ¥1.2 billion swing
Ordinary profit fell ¥1,001 million while operating profit rose ¥250 million, and the whole of that gap sits in non-operating items. Non-operating income fell from ¥775 million to ¥116 million and non-operating expense rose from ¥35 million to ¥628 million, a net move from plus ¥740 million to minus ¥512 million. One line dominates both sides: last year's non-operating income carried a ¥610 million crypto-asset valuation gain, and this year's non-operating expense carries a ¥599 million crypto-asset valuation loss — a single item swinging ¥1,209 million against the group. The carrying value of the crypto-assets fell from ¥1,236 million to ¥750 million even though the holding grew in quantity: bitcoin went from 59.1667 BTC at ¥1,048 million to 67.6895 BTC at ¥676 million, with dogecoin, XRP and solana making up the remainder. Everything else was small — interest expense ¥9 million, losses on receivable sales ¥6 million, investment-partnership losses ¥8 million.
Extraordinary items ran the other way but did not cover it. Extraordinary income was ¥220 million — a ¥153 million gain on the sale of affiliate shares and ¥67 million on investment securities — against ¥517 million last year, which included a ¥304 million gain on a business transfer. There was no extraordinary loss at all this year, against a ¥227 million impairment last year. Pretax profit was therefore ¥804 million against ¥1,875 million. Income taxes of ¥409 million took an effective rate of 50.9%, leaving net income of ¥395 million, of which ¥35 million belonged to non-controlling interests.
Media shrank and earned more, D2C compounded, games kept shrinking
Media Solution, 70% of revenue, saw sales fall 7.3% to ¥16,192 million but segment profit rise 31.5% to ¥1,745 million. Revenue lost the deconsolidation of Ateam Finergy (株式会社エイチームフィナジー) and reflected deliberately restrained advertising spend at the financial-media and recruitment-media businesses under a profit-first operating policy, partly offset by revenue from the company acquired by M&A. Profit rose because the sales-promotion provision reversal outweighed higher advertising costs at some existing media businesses facing sharper competition for traffic. D2C revenue rose 31.0% to ¥2,946 million and segment profit reached ¥186 million from ¥7 million, on a growing base of repeat subscribers to the cosmetics brand lujo (ルジョー), sold on an OEM model under which the group plans, develops and markets the products and outsources only manufacturing. Entertainment revenue fell 8.1% to ¥3,858 million and profit 40.3% to ¥309 million: game applications continued their overall decline, but the segment stayed in the black through efficient operation of existing titles and cost restraint. The three segments earned ¥2,241 million between them; unallocated corporate costs of ¥1,146 million, up from ¥1,008 million, bring the group back to ¥1,095 million.
The consolidation perimeter changed at both ends. Ateam Finergy, which ran the insurance comparison site Navinavi Hoken (ナビナビ保険), was sold to Sasuke Financial Lab on August 1, 2025 — the first day of the fiscal year — so this year's income statement contains none of its trading result, only the ¥153 million disposal gain. The company says escalating customer-acquisition costs had capped what a web-marketing-led strategy could deliver there. Going the other way, Signity (株式会社シグニティ), which runs the app-free push-notification service PUSH ONE and a smartphone lock-screen advertising platform, was acquired outright for ¥1,050 million in cash on November 20, 2025 and consolidated from December 1. It generated ¥776 million of goodwill and ¥321 million of customer-related intangibles, both amortised over nine years, alongside ¥52 million of advisory fees.
Negative operating cash flow, and a dividend well above earnings
Total assets fell ¥367 million to ¥14,841 million: goodwill up ¥533 million and customer-related assets up ¥261 million, against cash down ¥1,262 million. Liabilities fell ¥120 million to ¥5,919 million, as ¥830 million more long-term borrowing was outweighed by ¥457 million less income tax payable and a ¥426 million smaller sales-promotion provision. Net assets fell ¥247 million to ¥8,922 million and the equity ratio slipped to 58.5% from 59.3%. Operating cash flow turned negative at −¥467 million, from ¥1,624 million of inflow: pretax profit of ¥804 million was more than absorbed by ¥977 million of tax paid. Investing used ¥1,113 million, mainly the ¥1,013 million for Signity. Financing provided ¥254 million — ¥1,000 million of new long-term borrowing against ¥666 million of dividends — where last year it consumed ¥3,710 million, most of it a ¥3,222 million share buyback. Cash ended at ¥5,038 million against ¥6,301 million.
The dividend rose to ¥28.00 from ¥22.00, split ¥14.00 interim and ¥14.00 final where last year paid nothing at the interim stage and ¥22.00 at the year-end. At ¥522 million of total payment against ¥359 million of net profit, the consolidated payout ratio is 144.6%. FY7/2027 is guided to the same ¥28.00, which on ¥300 million of guided net profit would be 173.5%; the company's FY2025–FY2028 mid-term plan targets an average total-return ratio of 100% and says it will maintain a progressive dividend. Guidance for the year to July 2027 is revenue of ¥24,000 million (+4.4%), adjusted EBITDA of ¥1,200 million (+9.1%), EBITDA of ¥1,100 million (−27.0%), operating profit of ¥600 million (−45.2%), ordinary profit of ¥600 million (+2.7%) and net profit of ¥300 million (−16.6%), for earnings per share of ¥16.14. Operating profit and ordinary profit are guided to the same ¥600 million — that is, to no net non-operating item at all, against minus ¥512 million this year and plus ¥740 million last year. The filing sets out no line-by-line reconciliation of that assumption.
| Metric | FY7/2026 | FY7/2025 | Change |
|---|---|---|---|
| Revenue (¥ million) | 22,997 | 23,917 | −3.8% |
| Gross profit (¥ million) | 19,441 | 20,522 | −5.3% |
| SG&A expenses (¥ million) | 18,345 | 19,676 | −6.8% |
| Adjusted EBITDA (¥ million) | 1,100 | 1,719 | −36.0% |
| EBITDA (¥ million) | 1,506 | 1,273 | +18.3% |
| Operating profit (¥ million) | 1,095 | 845 | +29.6% |
| Operating margin | 4.8% | 3.5% | +1.3 pt |
| Ordinary profit (¥ million) | 584 | 1,585 | −63.2% |
| Net profit attrib. to owners of parent (¥ million) | 359 | 1,036 | −65.3% |
| Comprehensive income (¥ million) | 347 | 660 | −47.3% |
| EPS (¥) | 19.36 | 55.75 | −65.3% |
| Media Solution — revenue (¥ million) | 16,192 | 17,469 | −7.3% |
| Media Solution — segment profit (¥ million) | 1,745 | 1,327 | +31.5% |
| D2C — revenue (¥ million) | 2,946 | 2,248 | +31.0% |
| D2C — segment profit (¥ million) | 186 | 7 | n.m. |
| Entertainment — revenue (¥ million) | 3,858 | 4,199 | −8.1% |
| Entertainment — segment profit (¥ million) | 309 | 518 | −40.3% |
| Total assets (¥ million) | 14,841 | 15,209 | −2.4% |
| Net assets (¥ million) | 8,922 | 9,169 | −2.7% |
| Shareholders' equity (¥ million) | 8,676 | 9,021 | −3.8% |
| Equity ratio | 58.5% | 59.3% | −0.8 pt |
| FY7/2027 guidance — revenue (¥ million) | 24,000 | — | +4.4% |
| FY7/2027 guidance — adjusted EBITDA (¥ million) | 1,200 | — | +9.1% |
| FY7/2027 guidance — EBITDA (¥ million) | 1,100 | — | −27.0% |
| FY7/2027 guidance — operating profit (¥ million) | 600 | — | −45.2% |
| FY7/2027 guidance — ordinary profit (¥ million) | 600 | — | +2.7% |
| FY7/2027 guidance — net profit (¥ million) | 300 | — | −16.6% |
| FY7/2027 guidance — EPS (¥) | 16.14 | — | −16.6% |
| Annual dividend per share (¥) | 28.00 | 22.00 | +27.3% |
JapanStockPulse provides informational content only and does not constitute investment advice. Figures are taken from the company's published earnings short report and may be subject to subsequent revision.