Software and services grew; hardware fell by nearly a quarter
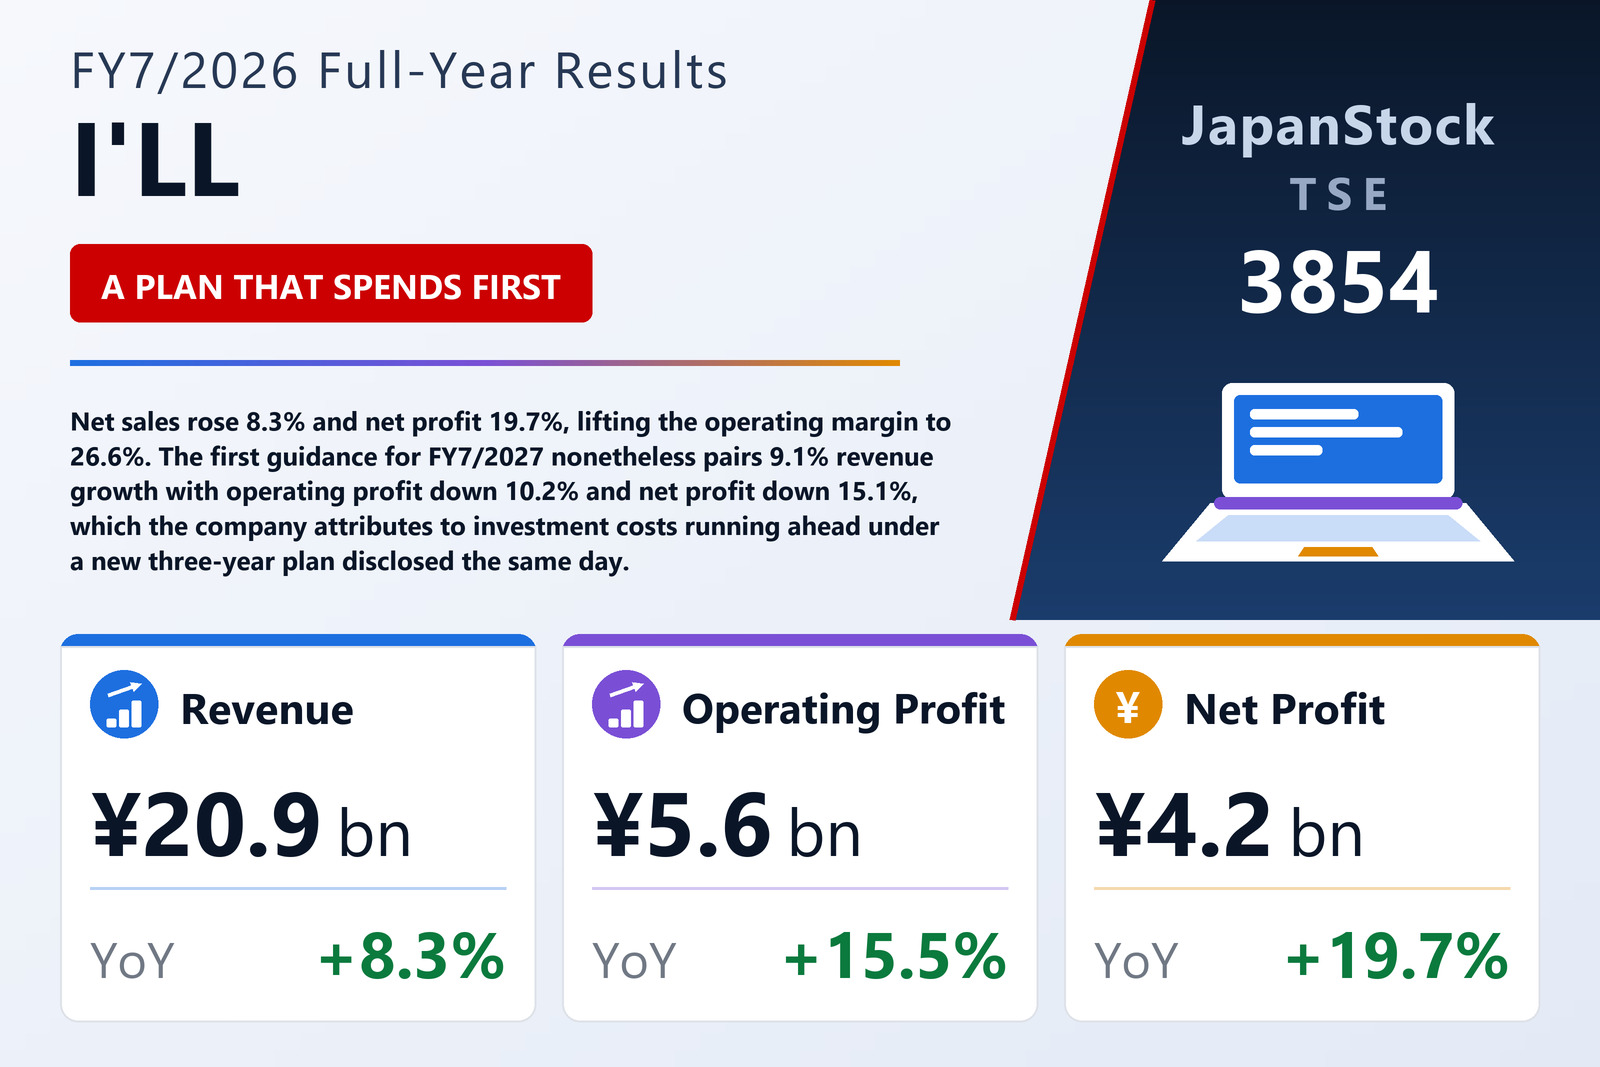
I'LL Inc. (TSE: 3854), the developer of the Aladdin Office (アラジンオフィス) core-business software package and of the CROSS MALL and CROSS POINT cloud services, published consolidated results for the year to July 31, 2026 on September 7, 2026 under Japanese GAAP. Net sales rose 8.3% to ¥20,889 million, operating profit 15.5% to ¥5,565 million, ordinary profit 17.6% to ¥5,607 million and net profit attributable to owners of the parent 19.7% to ¥4,175 million, for earnings per share of ¥167.01 against ¥141.32. Comprehensive income was ¥4,214 million, up 16.6%. One structural point shapes everything below: the group reports a single reportable segment, so it discloses no segment profit at all. It disaggregates only revenue, between a System Solutions business and a Web Solutions business.
System Solutions — core system construction, hardware maintenance, operations support, network build and security — produced revenue of ¥18,409 million, up 8.4%. Web Solutions, built on the CROSS MALL multi-shop e-commerce management service and the CROSS POINT loyalty and customer service, produced ¥2,479 million, up 7.5%. The composition of that revenue matters more than the split. Recurring "stock-type" revenue — service usage and system maintenance — rose 11.6% to ¥9,286 million, and licence, customisation and implementation work rose 17.6% to ¥9,155 million, while hardware revenue fell 22.9% to ¥2,323 million on delivery delays the company attributes to the semiconductor shortage. Revenue recognised over time reached ¥17,645 million from ¥15,379 million; revenue recognised at a point in time fell to ¥3,244 million from ¥3,915 million.
The margin widened because the lowest-margin line shrank
Cost of sales rose only 3.0% to ¥8,898 million against 8.3% more revenue, so gross profit rose 12.5% to ¥11,991 million and the gross margin widened from 55.2% to 57.4%. The company credits richer package functionality and an integrated sales-and-engineering organisation that improves quoting accuracy, partly offset by higher personnel costs and some purchase-price increases. Selling, general and administrative expenses rose 10.0% to ¥6,425 million, also on wages, leaving the operating margin at 26.6% against 25.0% — the metric management names as the group's own key indicator. Research and development spending nearly doubled, to ¥178 million from ¥92 million, centred on the I'LL Matsue Lab (アイル松江ラボ) in Matsue, Shimane Prefecture.
Below the operating line the amounts are small but they explain why ordinary profit outgrew operating profit. Non-operating income rose 44.9% to ¥42 million, driven by a ¥17 million increase in interest received to ¥21 million. Non-operating expenses fell 98.9% to ¥0.8 million, almost entirely because ¥73.2 million of commission payments in the prior year did not recur. Extraordinary items were negligible in both directions — a ¥44 thousand gain on a fixed-asset sale and a ¥166 thousand write-off. Pre-tax profit rose 17.7% to ¥5,607 million, and a total tax charge of ¥1,431 million — an effective rate of 25.5% against 26.8%, helped by a ¥287 million deferred-tax credit — left net profit up 19.7%. There is no diluted figure: the company has no potential shares.
The new three-year plan puts investment ahead of profit
Guidance for FY7/2027, issued for the first time with these results, pairs net sales of ¥22,800 million (+9.1%) with operating profit of ¥5,000 million (−10.2%), ordinary profit of ¥5,040 million (−10.1%) and net profit of ¥3,546 million (−15.1%), for earnings per share of ¥141.67. The outlook section sets out the strategy — deeper industry-specific functionality in Aladdin Office, stronger CROSS MALL and CROSS POINT, and the CROSS-OVER approach of proposing "real" and "Web" products together — but never says why profit falls. The explanation sits in the dividend section instead: a medium-term management plan covering FY7/2027 to FY7/2029, disclosed separately on the same day, revises the operating-profit target downward because investment costs run ahead temporarily, and net profit declines as a result. The first-half guidance is steeper still — revenue up 5.4% to ¥10,923 million but operating profit down 15.0% to ¥2,406 million — so the drag is expected to be front-weighted within the year as well as within the plan.
Cash fell ¥1,691 million while the balance sheet got stronger
The investing outflow rose to ¥3,509 million from ¥546 million, and the largest single item is not spending at all: ¥2,200 million was placed in time deposits, which sit outside cash and cash equivalents. Guarantee deposits absorbed ¥742 million and purchases of tangible fixed assets ¥395 million. Cash and cash equivalents therefore closed at ¥5,710 million, down ¥1,691 million, even though cash and deposits on the balance sheet rose ¥508 million over the same year — the fall is a reclassification, not a drain. Operating cash flow was ¥3,455 million against ¥3,366 million, after a ¥1,000 million contribution to a retirement benefit trust established in July 2026 and a ¥490 million increase in receivables and contract assets. The financing outflow narrowed to ¥1,638 million from ¥2,080 million: ¥1,550 million of dividends paid and ¥86 million of treasury-share purchases.
Total assets rose 13.9% to ¥17,961 million, with contract assets up ¥688 million and guarantee deposits up ¥728 million. Long-term liabilities fell ¥1,004 million, mostly the ¥1,070 million reduction in retirement benefit liabilities that the trust produced. Net assets rose 22.8% to ¥13,863 million and the equity ratio reached 77.2% from 71.6% — up from 59.7% in FY7/2022, improving in each of the four years since. Net assets per share were ¥554.56 against ¥450.94. The group is effectively unlevered: the filing reports a debt-repayment period of 0.0 years and an interest-coverage ratio of 4,897.6 times, on interest expense of ¥0.7 million for the whole year. Return on equity was 33.2%, a shade below the prior year's 33.3%.
The dividend rises even as profit is guided lower
The FY7/2026 year-end dividend was revised up by ¥1, to ¥35.00 from the ¥34.00 previously forecast, taking the annual dividend with the ¥32.00 interim to ¥67.00 against ¥50.00 for FY7/2025 — a total distribution of ¥1,676 million and a consolidated payout ratio of 40.1%. For FY7/2027 the company plans ¥70.00, split ¥35.00 at the interim and ¥35.00 at the year end, which against the lower guided profit lifts the payout ratio to 49.4%. That is deliberate: the stated policy benchmarks the payout ratio at 40% and targets 50%, and the filing says the per-share amount is being held at the FY7/2026 level specifically to keep the dividend stable while investment runs ahead. The two halves of this disclosure — a year that grew earnings 19.7% and a year guided to give 15.1% of them back — are meant to be read as one plan.
| Metric | FY7/2026 | FY7/2025 | Change |
|---|---|---|---|
| Revenue (¥ million) | 20,889 | 19,294 | +8.3% |
| Gross profit (¥ million) | 11,991 | 10,659 | +12.5% |
| Gross margin | 57.4% | 55.2% | +2.2 pt |
| SG&A expenses (¥ million) | 6,425 | 5,840 | +10.0% |
| Operating profit (¥ million) | 5,565 | 4,818 | +15.5% |
| Operating margin | 26.6% | 25.0% | +1.6 pt |
| Ordinary profit (¥ million) | 5,607 | 4,767 | +17.6% |
| Net profit attrib. to owners of parent (¥ million) | 4,175 | 3,488 | +19.7% |
| Comprehensive income (¥ million) | 4,214 | 3,613 | +16.6% |
| EPS (¥) | 167.01 | 141.32 | +18.2% |
| Return on equity | 33.2% | 33.3% | −0.1 pt |
| System Solutions — revenue (¥ million) | 18,409 | 16,989 | +8.4% |
| Web Solutions — revenue (¥ million) | 2,479 | 2,305 | +7.5% |
| Recurring (stock-type) revenue (¥ million) | 9,286 | 8,319 | +11.6% |
| Hardware revenue (¥ million) | 2,323 | 3,013 | −22.9% |
| Total assets (¥ million) | 17,961 | 15,768 | +13.9% |
| Net assets (¥ million) | 13,863 | 11,286 | +22.8% |
| Equity ratio | 77.2% | 71.6% | +5.6 pt |
| Net assets per share (¥) | 554.56 | 450.94 | +23.0% |
| Operating cash flow (¥ million) | 3,455 | 3,366 | +2.7% |
| Investing cash flow (¥ million) | −3,509 | −546 | n.m. |
| Cash and equivalents at year end (¥ million) | 5,710 | 7,402 | −22.9% |
| FY7/2027 guidance — revenue (¥ million) | 22,800 | — | +9.1% |
| FY7/2027 guidance — operating profit (¥ million) | 5,000 | — | −10.2% |
| FY7/2027 guidance — ordinary profit (¥ million) | 5,040 | — | −10.1% |
| FY7/2027 guidance — net profit (¥ million) | 3,546 | — | −15.1% |
| FY7/2027 guidance — EPS (¥) | 141.67 | — | −15.2% |
| Annual dividend per share (¥) | 70.00 | 67.00 | +4.5% |
| Dividend payout ratio | 49.4% | 40.1% | +9.3 pt |
JapanStockPulse provides informational content only and does not constitute investment advice. Figures are taken from the company's published earnings short report and may be subject to subsequent revision.