One line explains why net profit fell while operating profit jumped
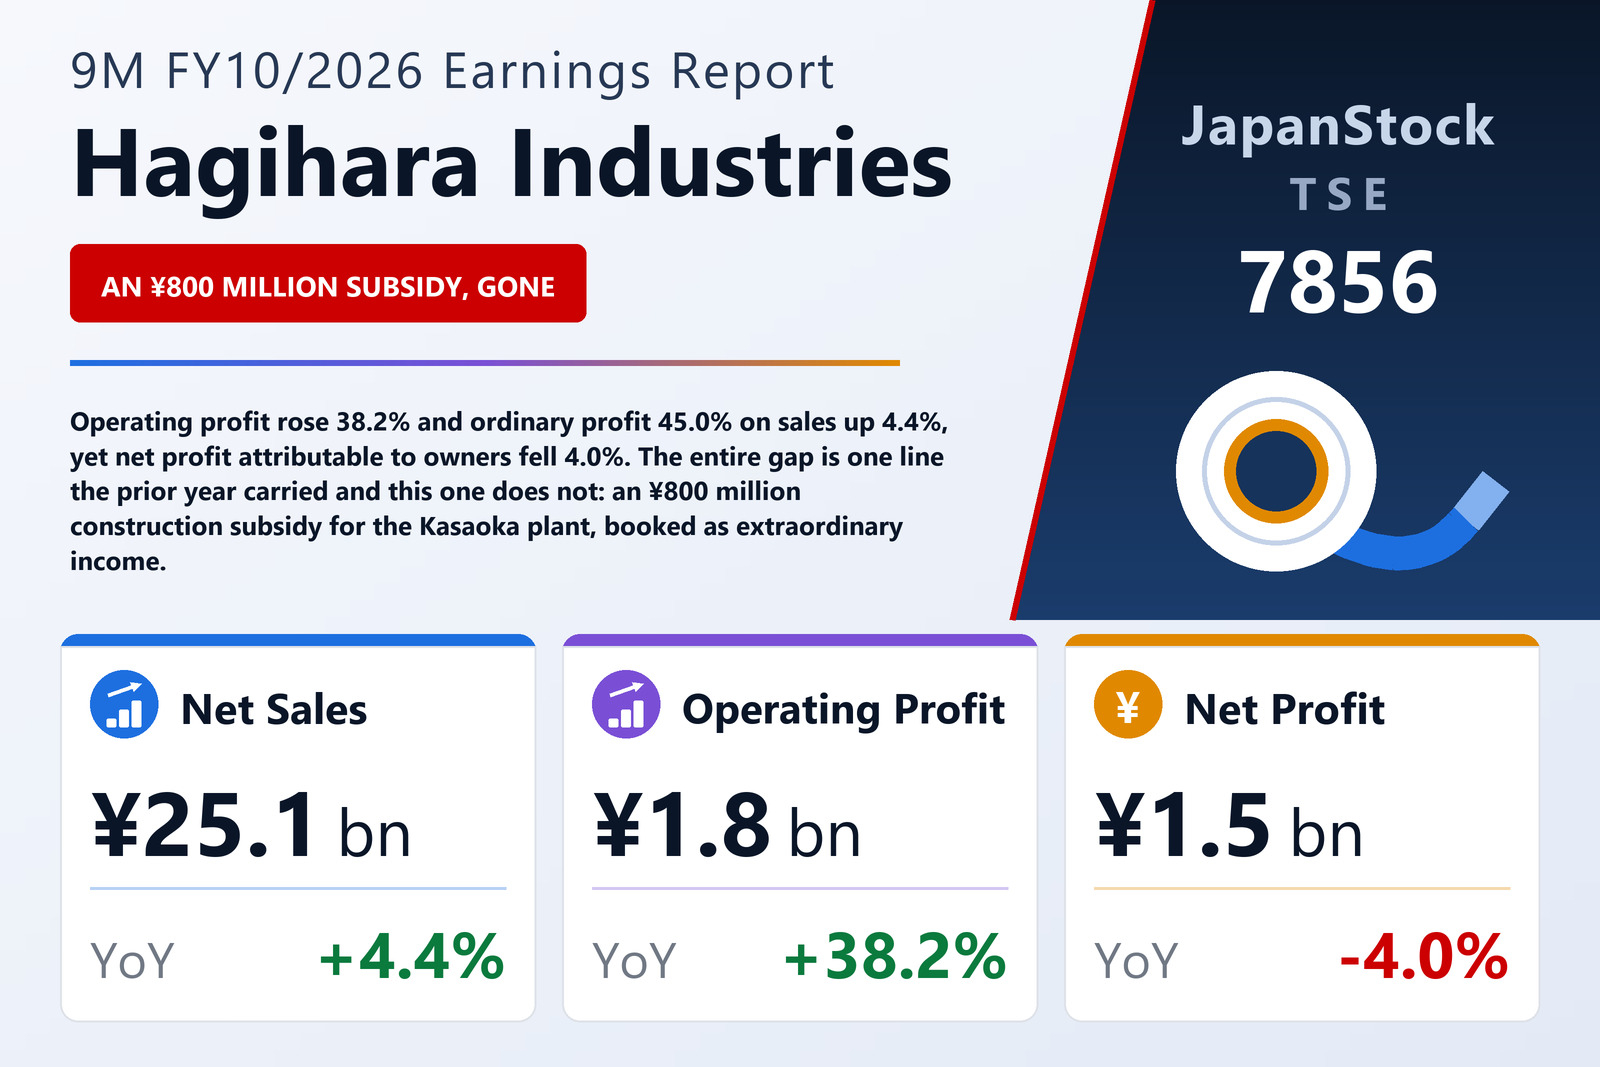
Hagihara Industries Inc. (TSE: 7856) — a maker of flat-yarn and synthetic-resin products such as tarpaulins, flexible container bags, packaging materials, artificial-turf yarn and concrete-reinforcing fibre, together with the slitting and extrusion machinery used to convert them — published consolidated results for the first nine months of FY10/2026, the period from November 1, 2025 to July 31, 2026, on September 7, 2026 under Japanese GAAP. Net sales rose 4.4% to ¥25,110 million, operating profit 38.2% to ¥1,841 million and ordinary profit 45.0% to ¥2,157 million. Net profit attributable to owners of the parent nonetheless fell 4.0% to ¥1,494 million, and earnings per share with it, to ¥106.19 from ¥111.68 (¥105.49 diluted, from ¥110.79). Comprehensive income was ¥2,122 million, up 38.4%.
The company states the reason for the divergence plainly. In the same nine months of the prior year it recorded an ¥800 million subsidy, granted in connection with the construction of its Kasaoka plant, as extraordinary income. This year there is no extraordinary income at all, so ordinary profit and pre-tax profit are the same ¥2,157 million figure — while a year ago pre-tax profit was ¥2,288 million, ordinary profit of ¥1,488 million plus the subsidy. On that basis pre-tax profit fell 5.7% even as ordinary profit rose 45.0%. Tax expense fell to ¥658 million from ¥734 million, net profit including non-controlling interests to ¥1,498 million from ¥1,554 million, and a ¥4 million profit attributable to non-controlling interests, against a ¥3 million loss a year earlier, left the parent's share at ¥1,494 million. Take the subsidy out of the prior year and the underlying comparison is the 45.0% increase the ordinary-profit line already shows.
Flat overheads turned 4.4% more sales into 38.2% more operating profit
Gross profit rose 7.8% to ¥7,009 million from ¥6,502 million — faster than the 4.4% sales gain, so on those figures the gross margin widened from 27.0% to 27.9%. Selling, general and administrative expenses were flat in yen at ¥5,168 million against ¥5,169 million. That combination is the whole operating-profit story: ¥507 million of extra gross profit met an overhead line that did not move, and the operating margin went from 5.5% to 7.3%. The company credits price revisions passing through in response to raw-material cost inflation, the development and stronger selling of high-value-added products, and a focus on environment-related and overseas markets, against demand weakened by inflation and labour shortages. Depreciation — disclosed in the notes because no consolidated cash flow statement was prepared for the nine months — rose to ¥1,645 million from ¥1,533 million, ¥112 million of extra fixed cost the gross margin absorbed; goodwill amortisation was ¥18 million in both periods.
Resin grew, machinery shrank, and machinery still earns more per yen of sales
The synthetic resin processed products segment, 85.5% of external sales, grew revenue 8.7% to ¥21,461 million and segment profit 44.2% to ¥1,529 million. The company credits price revisions passing through, additional demand arising from the situation in the Middle East, and growth in weather- and heat-resistant high-function sheeting, in flexible-container-related products on the return of a large customer, in heat-shielding yarn for agricultural materials and in artificial-turf yarn. Adhesive base fabric and the Meltac (メルタック) packaging material grew on price revisions alone, demand being soft, while overseas sales of Lamicross (ラミクロス) fell on U.S. trade policy. The Barchip (バルチップ) concrete-reinforcing fibre grew by taking new road-paving demand as price competition in mining sales tightened. Both subsidiaries named in the filing grew: the Indonesian Hagihara Westjava Industries (ハギハラ・ウエストジャワ・インダストリーズ) on price revisions and higher Barchip volume, and Toyo Heisei Polymer (東洋平成ポリマー) on strong film sales.
Machinery products did the opposite: revenue fell 15.1% to ¥3,649 million while segment profit rose 14.8% to ¥312 million. Paper slitters and film slitters, the segment's mainstay, both declined on weak Chinese investment demand; extrusion-related equipment grew on sales of screen changers for lithium-ion battery separators, and the recycling line grew on the first sale of advanced washing equipment developed from the company's horizontal-recycling technology for tarpaulins. On the stated figures the shrinking segment now earns the higher margin — 8.6% against 7.1% — and the two segment profits sum exactly to the group's ¥1,841 million, because the filing reports no unallocated corporate adjustment at all. The regional breakdown shows where the pressure sits: Japan rose to ¥17,867 million from ¥16,921 million and South America to ¥1,707 million from ¥1,214 million, while Asia fell to ¥2,978 million from ¥3,568 million, the region carrying the Chinese slitter demand. North America edged up to ¥1,466 million from ¥1,274 million despite the tariff drag on Lamicross, Europe to ¥439 million from ¥424 million and Oceania to ¥637 million from ¥631 million.
A currency gain is why ordinary profit outran operating profit
Ordinary profit rose ¥669 million against ¥508 million at the operating line, so ¥161 million of the improvement was made below it. Non-operating income rose to ¥401 million from ¥219 million, driven by a foreign exchange gain of ¥242 million against ¥53 million — the same weaker yen that added ¥697 million to the currency translation adjustment inside equity. Interest income rose to ¥28 million from ¥17 million and insurance proceeds fell to ¥21 million from ¥25 million, while non-operating expenses rose to ¥85 million from ¥63 million with interest paid of ¥31 million against ¥34 million. The ¥189 million improvement in the currency gain alone is larger than the whole ¥161 million of non-operating improvement, which means that without it the non-operating lines would have been a net drag. That makes the 45.0% ordinary-profit increase materially less durable than the 38.2% operating one.
Nine months have all but delivered the full-year forecast
Guidance for FY10/2026 is unchanged from the forecast published on December 8, 2025: net sales of ¥35,000 million (+9.6%), operating profit of ¥2,100 million (+43.1%), ordinary profit of ¥2,200 million (+21.1%) and net profit attributable to owners of ¥1,500 million (−16.4%), for earnings per share of ¥107.40. Set against the nine months just reported, that leaves remarkably little for the fourth quarter: ¥43 million of ordinary profit (¥2,200 million less ¥2,157 million), ¥6 million of net profit (¥1,500 million less ¥1,494 million) and ¥259 million of operating profit. Sales are the exception — the implied ¥9,890 million fourth quarter is well above the ¥8,370 million nine-month quarterly average. The filing gives no explanation for that profit shape, and the company left the forecast alone. Note also that the full-year net-profit guidance of −16.4% carries the same distortion as the quarter: the ¥800 million subsidy was booked inside the first nine months of FY10/2025 and therefore sits in the FY10/2025 full-year base.
The balance sheet grew in absolute terms and thinned slightly in ratio. Total assets rose to ¥44,846 million from ¥42,734 million: current assets rose ¥2,128 million to ¥23,264 million as inventories added ¥2,258 million and cash and deposits fell ¥1,524 million, while fixed assets were essentially unchanged at ¥21,582 million. Current liabilities rose ¥1,411 million to ¥9,239 million on ¥1,148 million more trade payables, and non-current liabilities fell ¥476 million to ¥3,464 million as long-term borrowings came down ¥558 million. Net assets rose ¥1,177 million to ¥32,142 million, with retained earnings contributing ¥502 million and the currency translation adjustment ¥697 million — so more of the equity gain came from the exchange rate than from retained profit. The equity ratio slipped to 71.5% from 72.3%, assets having grown faster than equity, and remains high in absolute terms. The dividend forecast is likewise unrevised at ¥75.00 for the year, ¥35.00 already paid at the interim and ¥40.00 due at the year-end, against ¥65.00 for FY10/2025.
A capital alliance with the Development Bank of Japan, announced the same day
The material subsequent-events note carries something larger than the quarter. At a board meeting held on September 7, 2026, the same day as this release, Hagihara Industries resolved to enter a capital and business alliance agreement with Development Bank of Japan Inc. and to dispose of treasury shares to the bank by third-party allotment. The company states that this involves a change in its major shareholders, including its largest major shareholder, and refers readers to a separate announcement issued the same day; this filing gives no share count, price or resulting ownership percentage. The only sizing it supplies is the treasury holding itself — 788,874 shares at July 31, 2026 against 835,373 at the prior year-end, out of 14,897,600 shares issued. Two further caveats belong with the figures above: these nine-month statements were not reviewed by an accounting auditor, and tax expense was computed by applying an estimated full-year effective rate to pre-tax quarterly profit rather than by a discrete calculation.
| Metric | 9M FY10/2026 | 9M FY10/2025 | Change |
|---|---|---|---|
| Net sales (¥ million) | 25,110 | 24,044 | +4.4% |
| Gross profit (¥ million) | 7,009 | 6,502 | +7.8% |
| Gross margin | 27.9% | 27.0% | +0.9 pt |
| SG&A expenses (¥ million) | 5,168 | 5,169 | −0.0% |
| Operating profit (¥ million) | 1,841 | 1,332 | +38.2% |
| Operating margin | 7.3% | 5.5% | +1.8 pt |
| Ordinary profit (¥ million) | 2,157 | 1,488 | +45.0% |
| Subsidy income, extraordinary gain (¥ million) | — | 800 | n.m. |
| Pre-tax profit (¥ million) | 2,157 | 2,288 | −5.7% |
| Net profit (¥ million) | 1,498 | 1,554 | −3.6% |
| Net profit attrib. to owners of parent (¥ million) | 1,494 | 1,557 | −4.0% |
| Comprehensive income (¥ million) | 2,122 | 1,533 | +38.4% |
| EPS (¥) | 106.19 | 111.68 | −4.9% |
| Synthetic Resin Processed Products — revenue (¥ million) | 21,461 | 19,747 | +8.7% |
| Synthetic Resin Processed Products — segment profit (¥ million) | 1,529 | 1,060 | +44.2% |
| Machinery Products — revenue (¥ million) | 3,649 | 4,296 | −15.1% |
| Machinery Products — segment profit (¥ million) | 312 | 271 | +14.8% |
| Foreign exchange gain, non-operating (¥ million) | 242 | 53 | +353.7% |
| Total assets (¥ million) | 44,846 | 42,734 | +4.9% |
| Net assets (¥ million) | 32,142 | 30,965 | +3.8% |
| Shareholders' equity (¥ million) | 32,081 | 30,900 | +3.8% |
| Equity ratio | 71.5% | 72.3% | −0.8 pt |
| FY10/2026 guidance — revenue (¥ million) | 35,000 | — | +9.6% |
| FY10/2026 guidance — operating profit (¥ million) | 2,100 | — | +43.1% |
| FY10/2026 guidance — ordinary profit (¥ million) | 2,200 | — | +21.1% |
| FY10/2026 guidance — net profit (¥ million) | 1,500 | — | −16.4% |
| FY10/2026 guidance — EPS (¥) | 107.40 | — | n.m. |
| Annual dividend per share (¥) | 75.00 | 65.00 | +15.4% |
JapanStockPulse provides informational content only and does not constitute investment advice. Figures are taken from the company's published earnings short report and may be subject to subsequent revision.