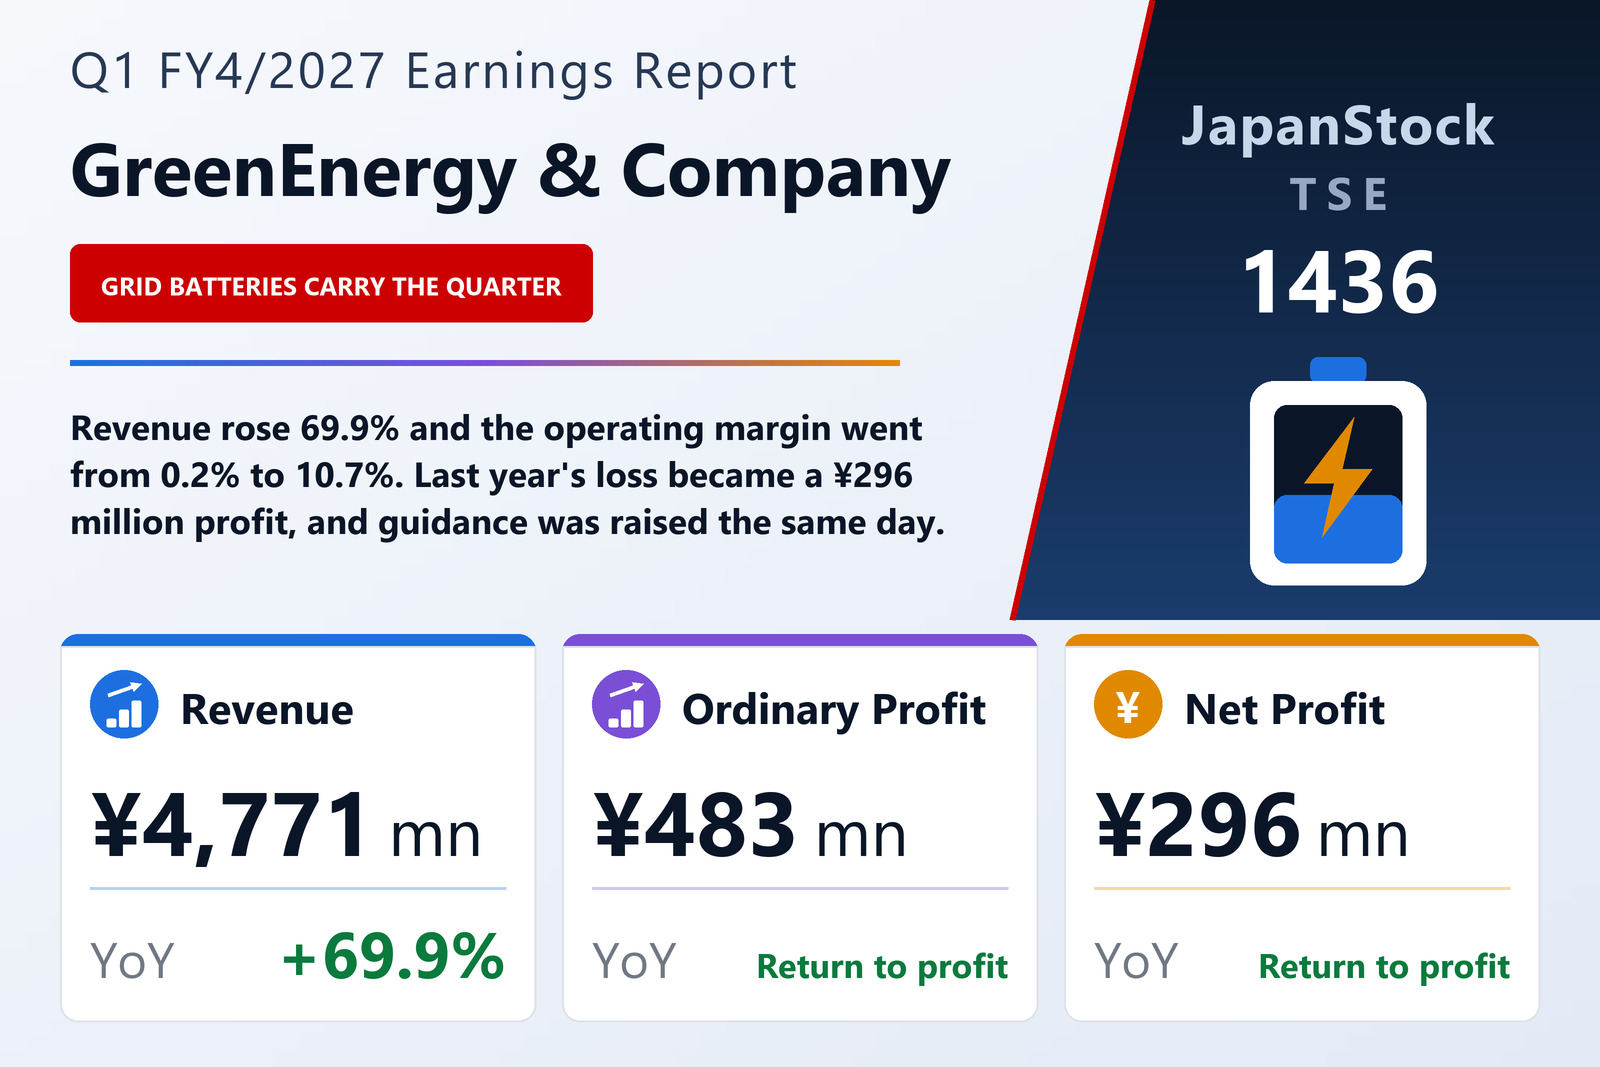
Revenue rose 69.9%, and the cost line did not follow
GreenEnergy & Company Inc. (TSE: 1436), the Tokyo-based group listed on the TSE Growth market that develops clean-energy projects, grid-scale storage batteries and housing and real estate, published consolidated results for the three months to July 31, 2026 — the first quarter of the year ending April 30, 2027 — on September 8, 2026 under Japanese GAAP. Revenue rose 69.9% to ¥4,771 million, operating profit reached ¥510 million against ¥5 million a year earlier, ordinary profit was ¥483 million against an ordinary loss of ¥6 million, and net profit attributable to owners of the parent was ¥296 million against a ¥10 million net loss. Earnings per share were ¥23.96 against a restated loss per share of ¥0.83, and a diluted figure of ¥22.68 appears for the first time — the prior-year column carries none. Comprehensive income equalled net profit in both periods, at ¥296 million and negative ¥10 million: the group reports no other comprehensive income at all.
The whole of that swing is made between the revenue line and the operating line. Cost of sales rose 59.9% while revenue rose 69.9%, so gross profit more than doubled, to ¥1,287 million from ¥629 million — an increase of 104.7% computed from the income statement's own ¥1,287,886 thousand against ¥629,007 thousand — and the gross margin widened to 27.0% from 22.4%. Selling, general and administrative expenses grew only 24.7%, to ¥777 million, so their share of revenue fell to 16.3% from 22.2% and the operating margin went to 10.7% from 0.2%. Stated in the thousands the filing itself uses, operating profit of ¥510,447 thousand against ¥5,773 thousand is the 8,741% increase the management discussion reports. The cover page prints a dash rather than a percentage, because at the ¥ million rounding it applies the prior-year figure is only ¥5 million, and the table below follows the cover and leaves the arithmetic to this paragraph.
Below the operating line, a bigger interest bill
Non-operating income of ¥13 million against non-operating expenses of ¥39 million is what takes ¥510 million of operating profit down to ¥483 million of ordinary profit, and the largest single line is interest paid, at ¥34,112 thousand against ¥26,275 thousand — consistent with a balance sheet that ended the quarter carrying ¥3,438 million more short-term debt than it started with. Equity-method investment income rose to ¥7,331 thousand from ¥2,706 thousand while interest received fell to ¥1,283 thousand from ¥2,685 thousand, and the prior year's non-operating income also included ¥11,600 thousand of insurance proceeds that did not recur. Extraordinary items were immaterial on both sides — a ¥22 thousand gain and a ¥139 thousand loss, both on disposals of fixed assets — leaving pre-tax profit of ¥483,727 thousand. Income taxes of ¥187,373 thousand are a 38.7% charge on that figure, and the notes disclose that the group applies an estimated annual effective tax rate to quarterly pre-tax profit rather than computing tax on the quarter itself. A year earlier it booked ¥5,978 thousand of tax on a pre-tax loss, which is how a ¥4 million pre-tax loss became a ¥10 million net loss.
The balance sheet is the other half of the story
Total assets grew ¥4,075 million in three months, to ¥20,615 million, and almost all of the increase is inventory and money paid out ahead of delivery. Current assets rose ¥4,028 million to ¥17,346 million: work in process rose ¥2,191 million to ¥5,104 million, advance payments to suppliers rose ¥1,525 million to ¥4,445 million and real estate held for sale rose ¥296 million to ¥2,673 million, while cash fell ¥145 million to ¥1,882 million. Fixed assets barely moved, up ¥46 million to ¥3,269 million, and inside that total tangible assets, intangibles and investment securities all declined; the only material increase is ¥100 million of deferred tax assets. For a developer that builds projects and sells them, this is a quarter spent assembling the next several quarters' revenue rather than harvesting this one's.
The build-out is debt-funded. Short-term borrowings rose ¥3,438 million to ¥4,581 million, four times the ¥1,143 million outstanding at the April year-end, and advances received from customers rose ¥560 million to ¥3,551 million while trade payables added ¥189 million. Current liabilities rose ¥4,048 million to ¥10,964 million; long-term liabilities fell ¥109 million as long-term borrowings were repaid down ¥77 million and bonds down ¥30 million. Net assets rose only ¥136 million, to ¥5,830 million, so the equity ratio fell 6.0 points to 28.3% from 34.3%. Two items moved shareholders' equity in opposite directions: retained earnings absorbed the quarter's profit but paid out ¥61,835 thousand of dividends, and capital surplus fell ¥82,700 thousand on an additional purchase of subsidiary shares — the same transaction that removed the ¥9,350 thousand of non-controlling interests from the balance sheet. No quarterly cash flow statement was prepared, so the movement has to be read off the balance sheet; the notes disclose depreciation of ¥46,987 thousand against ¥24,598 thousand and goodwill amortisation of ¥20,104 thousand against ¥24,883 thousand.
A ¥2 million acquisition that came with negative net assets
On June 30, 2026 the company signed and completed the purchase of 100% of the equity of Godo Kaisha CC (合同会社CC) for ¥2,000 thousand in cash, the only change to the scope of consolidation this quarter, and just one month of the vehicle's results — July 2026 — is included. It came with ¥20,134 thousand of assets against ¥28,992 thousand of liabilities, so the price bought a negative net asset position and the deal produced ¥10,857 thousand of goodwill, to be amortised in equal instalments over five years. The filing is worth reading twice on what was bought: it describes the target's business as the operation of a grid-scale storage battery site, while giving the reason for the deal as the expansion of renewable generation through the acquisition of a solar power plant, structured as the purchase of the entity that owns it. The pro-forma effect had the combination been completed at the start of the year is described as immaterial and is not disclosed.
Guidance raised the same day; the dividend needs the split
The tanshin flags a revision to previously announced guidance and refers readers to a separate release issued the same day, a Notice of Upward Revision of Earnings Forecast. The revised full-year FY4/2027 figures are revenue of ¥21,500 million (+17.1%), operating profit of ¥1,740 million (+46.0%), ordinary profit of ¥1,550 million (+50.5%) and net profit attributable to owners of ¥960 million (+91.9%), for earnings per share of ¥77.63. A first-half cumulative forecast is given as well: revenue of ¥10,000 million (+39.2%), operating profit of ¥800 million (+162.9%), ordinary profit of ¥710 million (+192.8%) and net profit of ¥440 million (+190.4%). The tanshin does not print the superseded numbers, so the size of the upgrade cannot be read from this document. What can be read is the run-rate: dividing the quarter into the guidance gives revenue at 22.2% of the full year and 47.7% of the half, and operating profit at 29.3% of the full year and 63.8% of the half.
The dividend forecast was not revised, and the two years in the dividend table cannot be compared as printed. A three-for-one stock split took effect on May 1, 2026, the first day of this fiscal year, and the filing states that the FY4/2026 line shows the actual pre-split amount. That year paid ¥15.00 per share, all of it at the year-end; FY4/2027 is forecast at ¥6.00, again all at the year-end. Multiplied by the split ratio the forecast is the equivalent of ¥18.00 on the old share count, so it is a 20% increase, not a 60% cut. The same split is why the prior-year loss per share is restated to ¥0.83 and why the weighted average share count of 12,367,095 is comparable with the prior year's 12,341,281; 12,857,400 shares are issued, of which 490,305 are held in treasury. Two further things a reader should know: the group reports as a single segment and gives no segment table for either period, so the clean-energy, housing and real-estate and storage-battery activities the management discussion describes cannot be sized separately from this filing; and the quarterly statements have not been reviewed by an accounting auditor, while the filing reports no material subsequent events.
| Metric | Q1 FY4/2027 | Q1 FY4/2026 | Change |
|---|---|---|---|
| Revenue (¥ million) | 4,771 | 2,807 | +69.9% |
| Gross profit (¥ million) | 1,287 | 629 | +104.7% |
| SG&A expenses (¥ million) | 777 | 623 | +24.7% |
| Operating profit (¥ million) | 510 | 5 | n.m. |
| Operating margin | 10.7% | 0.2% | +10.5 pt |
| Ordinary profit (¥ million) | 483 | −6 | loss to profit |
| Net profit attrib. to owners of parent (¥ million) | 296 | −10 | loss to profit |
| Comprehensive income (¥ million) | 296 | −10 | loss to profit |
| EPS (¥) | 23.96 | −0.83 | loss to profit |
| Total assets (¥ million) | 20,615 | 16,540 | +24.6% |
| Net assets (¥ million) | 5,830 | 5,694 | +2.4% |
| Equity ratio | 28.3% | 34.3% | −6.0 pt |
| FY4/2027 guidance — revenue (¥ million) | 21,500 | — | +17.1% |
| FY4/2027 guidance — operating profit (¥ million) | 1,740 | — | +46.0% |
| FY4/2027 guidance — ordinary profit (¥ million) | 1,550 | — | +50.5% |
| FY4/2027 guidance — net profit (¥ million) | 960 | — | +91.9% |
| FY4/2027 guidance — EPS (¥) | 77.63 | — | n.m. |
| Annual dividend per share (¥) | 6.00 | 15.00 | n.m. |
JapanStockPulse provides informational content only and does not constitute investment advice. Figures are taken from the company's published earnings short report and may be subject to subsequent revision.