A merger removed the year-earlier comparison
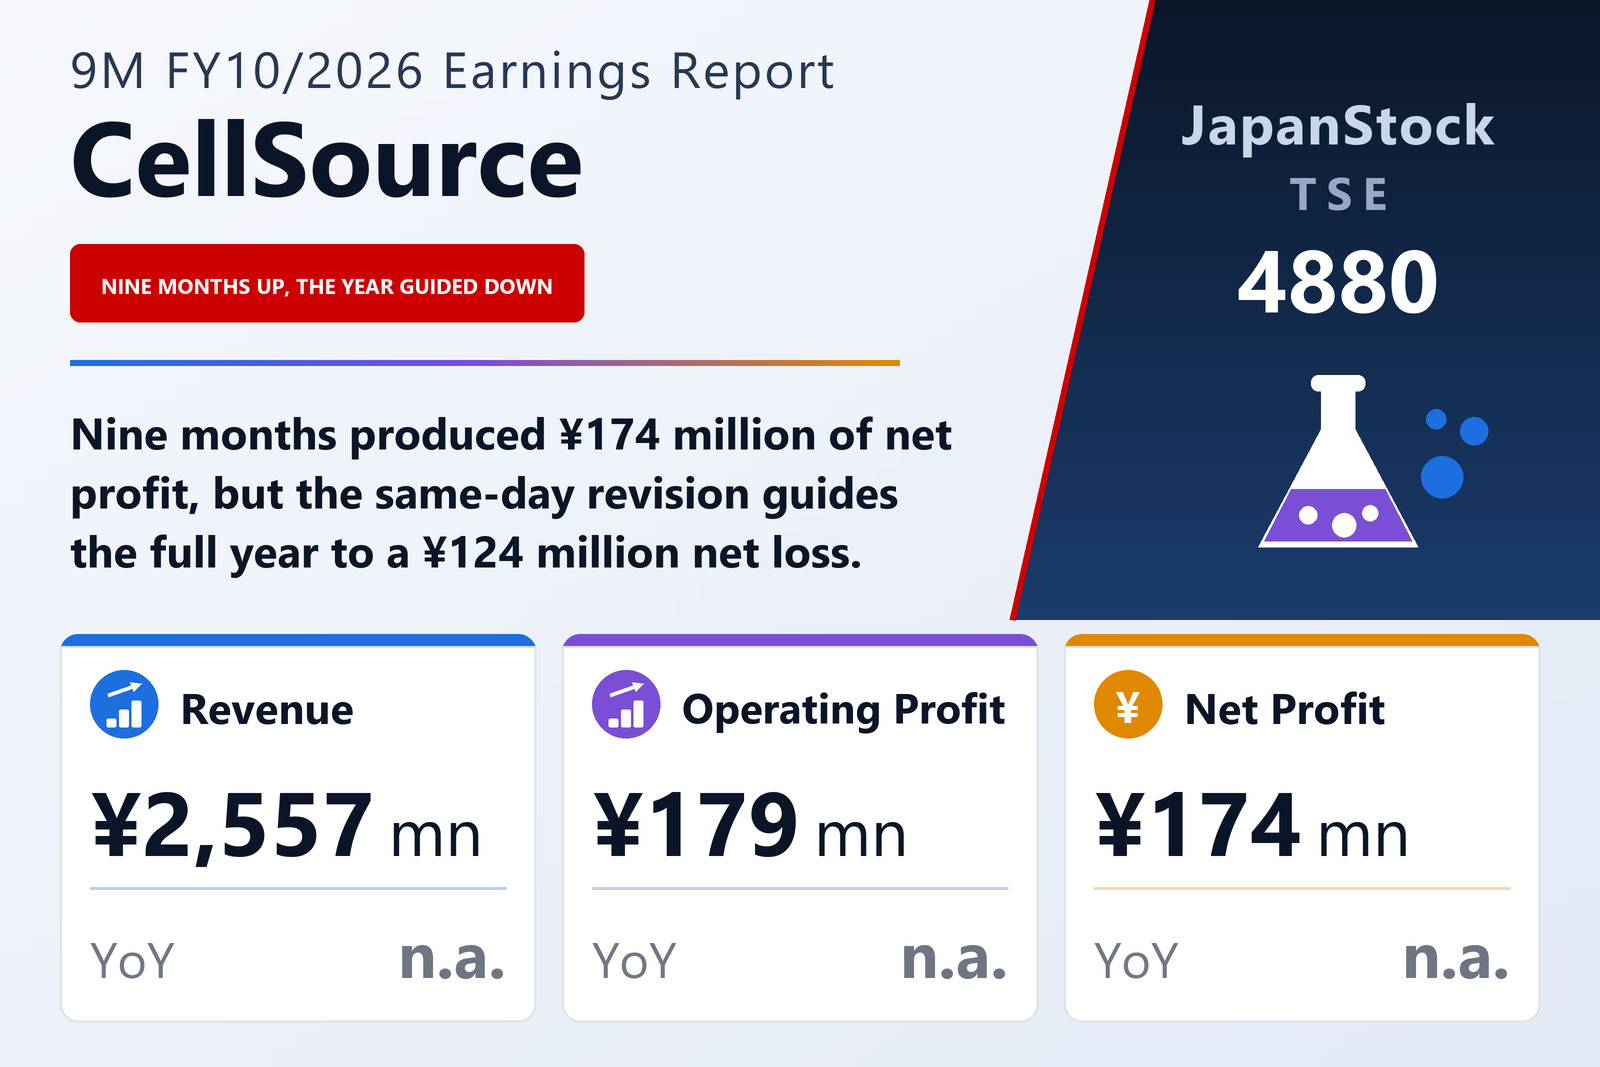
CellSource Co., Ltd. (TSE: 4880), the Tokyo-based regenerative-medicine company that processes blood-derived and fat-derived cells under contract for Japanese clinics, published results for the nine months to July 31, 2026 on September 8, 2026 under Japanese GAAP. Revenue was ¥2,557 million, gross profit ¥1,507 million, selling, general and administrative expenses ¥1,328 million, operating profit ¥179 million, ordinary profit ¥174 million, pre-tax profit ¥232 million and net profit ¥174 million, for earnings per share of ¥8.80 and ¥8.77 fully diluted. Every prior-year column in the profit and loss table is a dash. On July 1, 2026 the company absorbed its consolidated subsidiary Hybrid Medical Inc. and moved from consolidated to non-consolidated reporting from this third quarter; because this is the first year on a single-entity basis, the filing states no year-earlier profit figures and no growth rates against them.
The merger leaves three visible traces. Shares in affiliates fell to nil from ¥200.0 million as the subsidiary ceased to exist, intangible fixed assets rose ¥80.7 million to ¥137.1 million, and the income statement carries ¥65.6 million of gain on extinguishment of the merged subsidiary's shares in extraordinary income. Retained earnings rose ¥75.4 million over the nine months, which the company attributes mainly to that gain. The ¥99.1 million by which the ¥174.5 million of net profit exceeds that increase matches the ¥5.00 a share year-end dividend for FY10/2025, paid during the period on the 19,819,382 shares outstanding net of treasury.
More partner clinics, fewer procedures
The company runs a single reportable segment, the regenerative-medicine-related business, but discloses four service lines within it. Processing contracts produced ¥1,703.0 million, 66.6% of revenue; medical-device sales ¥610.4 million, or 23.9%, which the company says rose on higher sales to customers; cosmetics and other ¥186.1 million, or 7.3%, held back by weaker business-to-business cosmetics; and medical-institution support ¥58.0 million, or 2.3%, a line the merger enlarged. The operational story sits inside the first of those. The number of partner medical institutions holding a processing or support contract reached 2,218 at quarter-end, up 116 from the last fiscal year-end and up 35 in the quarter alone. But the count of blood-derived and adipose-stem-cell processing orders fell to 15,258 from 15,881 a year earlier — 623 fewer, or 3.9%. More clinics signed; fewer procedures ordered. The filing also publishes its own quarterly operating-margin series, 10.7%, 4.9%, 4.2%, 5.3% and 11.5% across the last five quarters, with the caveat that everything up to the fourth quarter of FY10/2025 is consolidated and everything from the first quarter of FY10/2026 is single-entity, so the series is not strictly comparable across that break. Adding up the four service lines quarter by quarter gives revenue of ¥816.5 million, ¥882.6 million and ¥858.4 million — so the margin more than doubled in the third quarter on slightly lower revenue than the second.
The profit is a cost result, and part of it is a one-off
Gross profit of ¥1,507 million on ¥2,557 million of revenue is a gross margin of 58.9%; SG&A of ¥1,328 million absorbs 51.9% of revenue, leaving an operating margin of 7.0%. The company's own account of the nine months is almost entirely about cost: it says it continued to optimise the allocation of management resources, executed further cost reductions centred on selling, general and administrative expenses, and reached a conclusion on which businesses to keep and concentrate on. Two extraordinary losses look like that decision being booked — ¥11.7 million of impairment and ¥2.4 million of store-withdrawal loss. It also says it co-developed a new exosome processing technology with a business partner, as planned at the start of the year. Below the operating line, ¥14.6 million of non-operating income met ¥19.6 million of non-operating expense, the largest single item being ¥11.9 million of losses on investment-partnership holdings. Extraordinary items then added a net ¥58.2 million and tax took ¥57.9 million back out, which is why net profit of ¥174.5 million lands within ¥0.4 million of ordinary profit. The merger gain alone is 28.2% of the ¥232.4 million of pre-tax profit, and it will not recur.
The guidance says the fourth quarter undoes the nine months
The full-year forecast was revised on the day of this filing. The company says it revised the FY10/2026 forecast it had published on July 29, 2026 in light of the nine-month result, and refers readers to a separate release issued the same day, "Notice of Revision to Earnings Forecast" — the reasoning is in that document, not in this one, and nothing in this filing supplies it. The revised year is revenue of ¥3,367 million, operating profit of ¥82 million, ordinary profit of ¥76 million and a net loss of ¥124 million, or a loss of ¥6.26 a share. Set against the nine months already reported, that arithmetic implies a fourth quarter of about ¥810 million of revenue — below each of the first three quarters — an operating loss of roughly ¥97 million and a net loss of roughly ¥298 million. The ¥201 million by which the implied net loss exceeds the implied operating loss is not explained anywhere in this document. The dividend forecast for the year is ¥0.00 against ¥5.00 paid for FY10/2025, but that is not a cut announced today: the revision flag on the dividend table reads "none", so the zero was already the standing forecast, and the filing gives no reason for it.
A balance sheet that is 68% cash
Total assets were ¥6,945 million, down ¥15.6 million over the nine months, of which ¥4,729 million — 68.1% — is cash and deposits, up ¥267.3 million. Tangible fixed assets fell ¥121.6 million to ¥867.2 million and shares in affiliates fell ¥200.0 million to nil, while intangibles rose. Liabilities fell ¥95.6 million to ¥877.8 million: the non-current provision for contract losses fell ¥62.0 million to ¥165.1 million and other provisions fell ¥48.2 million to ¥27.9 million, while the current portion of the contract-loss provision rose to ¥60.7 million from ¥36.5 million — so the total contract-loss provision fell to ¥225.8 million from ¥263.5 million, with part of what remains reclassified as due within a year. Net assets rose ¥80.0 million to ¥6,067 million, owners' equity to ¥5,958 million from ¥5,872 million, and the equity ratio improved to 85.8% from 84.4%. No quarterly cash-flow statement was prepared; the filing discloses depreciation of ¥133.5 million for the nine months, and the statements were not reviewed by an accounting auditor.
| Metric | 9M FY10/2026 | 9M FY10/2025 | Change |
|---|---|---|---|
| Revenue (¥ million) | 2,557 | — | new |
| Gross profit (¥ million) | 1,507 | — | new |
| SG&A expenses (¥ million) | 1,328 | — | new |
| Operating profit (¥ million) | 179 | — | new |
| Operating margin | 7.0% | — | new |
| Ordinary profit (¥ million) | 174 | — | new |
| Pre-tax profit (¥ million) | 232 | — | new |
| Net profit (¥ million) | 174 | — | new |
| EPS (¥) | 8.80 | — | new |
| Partner medical institutions (quarter-end) | 2,218 | 2,057 | +7.8% |
| Processing orders — blood- and adipose-derived | 15,258 | 15,881 | −3.9% |
| Total assets (¥ million) | 6,945 | 6,960 | −0.2% |
| Net assets (¥ million) | 6,067 | 5,987 | +1.3% |
| Shareholders' equity (¥ million) | 5,958 | 5,872 | +1.5% |
| Equity ratio | 85.8% | 84.4% | +1.4 pt |
| FY10/2026 guidance — revenue (¥ million) | 3,367 | — | n.m. |
| FY10/2026 guidance — operating profit (¥ million) | 82 | — | n.m. |
| FY10/2026 guidance — ordinary profit (¥ million) | 76 | — | n.m. |
| FY10/2026 guidance — net profit (¥ million) | −124 | — | n.m. |
| FY10/2026 guidance — EPS (¥) | −6.26 | — | n.m. |
| Annual dividend per share (¥) | 0.00 | 5.00 | −100.0% |
JapanStockPulse provides informational content only and does not constitute investment advice. Figures are taken from the company's published earnings short report and may be subject to subsequent revision.